2019 State and City TB Report
Incidence1
Elimination of TB is defined as reducing TB disease incidence in the United States to less than 1 case per million persons per year. Therefore, measuring the number of new cases occurring each year remains the best overall indicator of progress toward TB elimination. In 2019, overall TB incidence in the United States was 2.7 TB cases (including U.S.-born and non-U.S.–born persons) per 100,000 persons (27 cases per million). Overall, TB incidence decreased from 2018 to 2019; however, the nation has not yet achieved the 2025 national target of <1.3 TB cases per 100,000 (Figure 1, Figure 2).
Overall TB Incidence in the United States, 2019
In 2019, 42 states reported incidences at or below the national average of 2.7 cases per 100,000 (including U.S.-born and non-U.S.-born persons). Incidences in 8 states and 9 cities were above the national average.
States/cities are grouped into thirds based on numbers of TB cases reported in 2019.
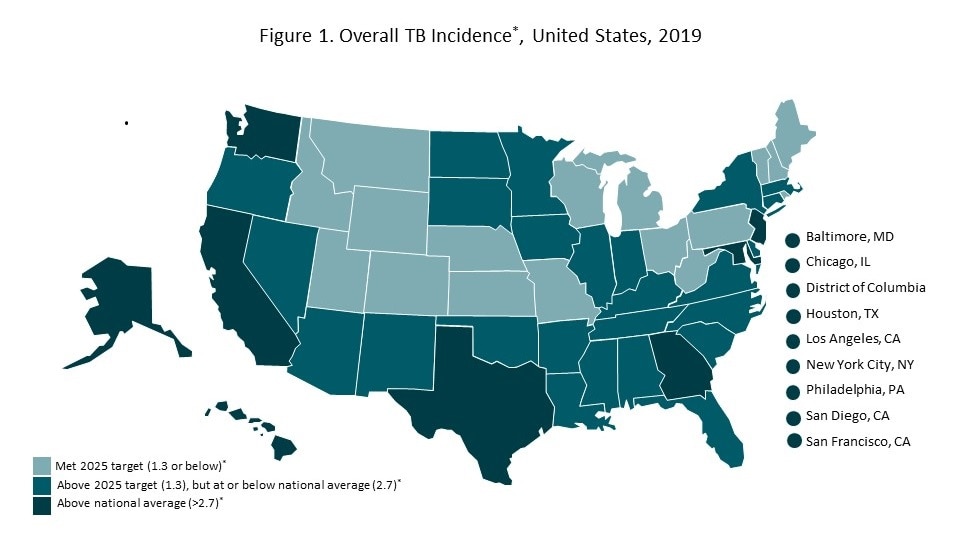
Figure 1: Overall TB Incidence in the United States, 2019

Figure 2: Overall TB Incidence in the United States, 2019
TB Incidence Among U.S.-born Persons in the United States, 2019
In 2019, a total of 17 states met the 2025 national target of 0.4 cases per 100,000 U.S.-born persons; 18 states were short of the
2025 target, but reported incidences at or below the national average of 0.9 cases per 100,000 U.S.-born persons. Thirteen states and 9 cities were above the national average of 0.9 cases per 100,000 U.S.-born persons. Two states reported 0 TB cases among U.S.-born persons.
States/cities are grouped into thirds based on numbers of TB cases reported in 2019.

Figure 3: TB Incidence Among U.S.-born Persons in the United States, 2019

Figure 4: TB Incidence Among U.S.-born Persons in the United States, 2019
TB Incidence Among Non-U.S.–born Persons in the United States, 2019
In 2019, a total of 9 states met the 2025 target of 8.8 cases per 100,000 non-U.S.-born persons; 19 states and 1 city were short of the 2025 target, but still reported incidences at or below the national average of 14.2 cases per 100,000 non-U.S.-born persons. The remaining 21 states and 8 cities were above the 2025 target and national average. One state reported 0 TB cases among non-U.S.-born persons.
States/cities are grouped into thirds based on numbers of TB cases reported in 2019.

Figure 5: TB Incidence Among Non-U.S.–born Persons in the United States, 2019

Figure 6: TB Incidence Among Non-U.S.–born Persons in the United States, 2019
TB Incidence Among U.S.-born Non-Hispanic Blacks or African Americans, United States, 2019
In 2019, 5 states met the 2025 national target of 1.0 cases per 100,000 U.S.-born non-Hispanic black persons; 20 states and 3 cities were short of the 2025 target, but reported incidences at or below the national average of 2.5 cases per 100,000 U.S.-born non-Hispanic black persons. Fourteen states and 6 cities reported incidences above the 2025 target and national average. Eleven states did not report any cases of TB among U.S.-born non-Hispanic black persons.

Figure 7: TB Incidence Among U.S.-born Non-Hispanic Blacks or African Americans, United States, 2019

Figure 8: TB Incidence Among U.S.-born Non-Hispanic Blacks or African Americans, United States, 2019
1Centers for Disease Control and Prevention (CDC). Reported Tuberculosis in the United States, 2019. Atlanta, GA: US Department of Health and Human Services, CDC; 2020.
Figures 1 and 2: Overall TB Incidence*, United States, 2019
Data source: National Tuberculosis Surveillance System as of June 10, 2020; population data from the U.S. Census Bureau’s American Community Survey, 2018.
*Numbers of TB cases per 100,000 persons
Figures 3 and 4: TB Incidence,* U.S.-born Persons, United States, 2019
Data source: National Tuberculosis Surveillance System as of June 10, 2020; population data from the U.S. Census Bureau’s American Community Survey, 2018.
*Numbers of TB cases per 100,000 U.S.-born persons
Figures 5 and 6: TB Incidence,* Non-U.S.–born Persons, United States, 2019
Data source: National Tuberculosis Surveillance System as of June 10, 2020; population data from the U.S. Census Bureau’s American Community Survey, 2018.
*Numbers of TB cases per 100,000 non-U.S.–born persons
Figures 7 and 8: TB Incidence,* U.S.-born Non-Hispanic Blacks or African Americans, United States, 2019
Data source: National Tuberculosis Surveillance System as of June 10, 2020; population data from the U.S. Census Bureau’s American Community Survey, 2018.
*Numbers of TB cases per 100,000 U.S.-born non-Hispanic black persons