


What to know
Overview
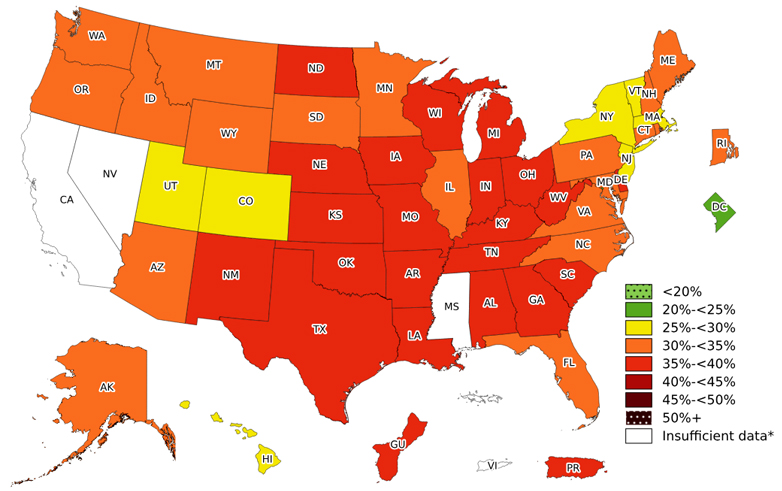
The CDC 2025 Adult Obesity Prevalence Maps for 47 states, the District of Columbia (DC), Guam, and Puerto Rico show the proportion of adults with a body mass index (BMI) greater than or equal to 30 kg/m2 based on self-reported weight and height. Data are presented by location, age, education level, and race and ethnicity. The data come from the Behavioral Risk Factor Surveillance System, an ongoing state-based, telephone interview survey conducted by CDC and state health departments.
The 2025 maps show that obesity impacts some groups more than others. There are notable differences by individual characteristics, including by location, age, education level, and race and ethnicity.
See adult BMI categories.
By location across states and territories
In 2025, among U.S. states and territories with available data, all had an obesity prevalence higher than 25%, except the District of Columbia (24.2%). Overall, the Midwest (35.5%) and South (34.8%) had the highest prevalence of obesity, followed by the West (30.7%) and the Northeast (29.6%).
- One jurisdiction (District of Columbia) had an obesity prevalence between 20% and less than 25%.
- 7 states had an obesity prevalence between 25% and less than 30%.
- 19 states had an obesity prevalence between 30% and less than 35%.
- 21 states, Guam, and Puerto Rico had an obesity prevalence between 35% and less than 40%.
- No state or territory had an obesity prevalence of 40% or higher.
In 2025, the prevalence of adult obesity varied by age. Middle-aged adults (40-59 years) are about 36% more likely to have obesity than younger adults (18-39 years) and 25% more likely to have obesity than older adults (60 and older). Among U.S. states and territories with available data, the number with an obesity prevalence of 35% or higher is:
- 6 states and 1 territory among adults 18–39 years.
- 40 states and 2 territories among adults 40–59 years.
- 11 states and 1 territory among adults 60 years and older.
In 2025, among U.S. states and territories with available data, obesity prevalence was highest among adults without a high school diploma or equivalent (38.1%) and lowest among college graduates (27.8%).
- 38.1% of adults without a high school diploma or equivalent had obesity.
- 35.1% of adults with a high school diploma or equivalent had obesity.
- 36.8% of adults with some college education had obesity.
- 27.8% of college graduates had obesity.
Combined BRFSS data from 2023–2025 show notable differences in adult obesity prevalence by race and ethnicity. Among states, territories, or DC with enough data, the number with an obesity prevalence of 35% or higher is:
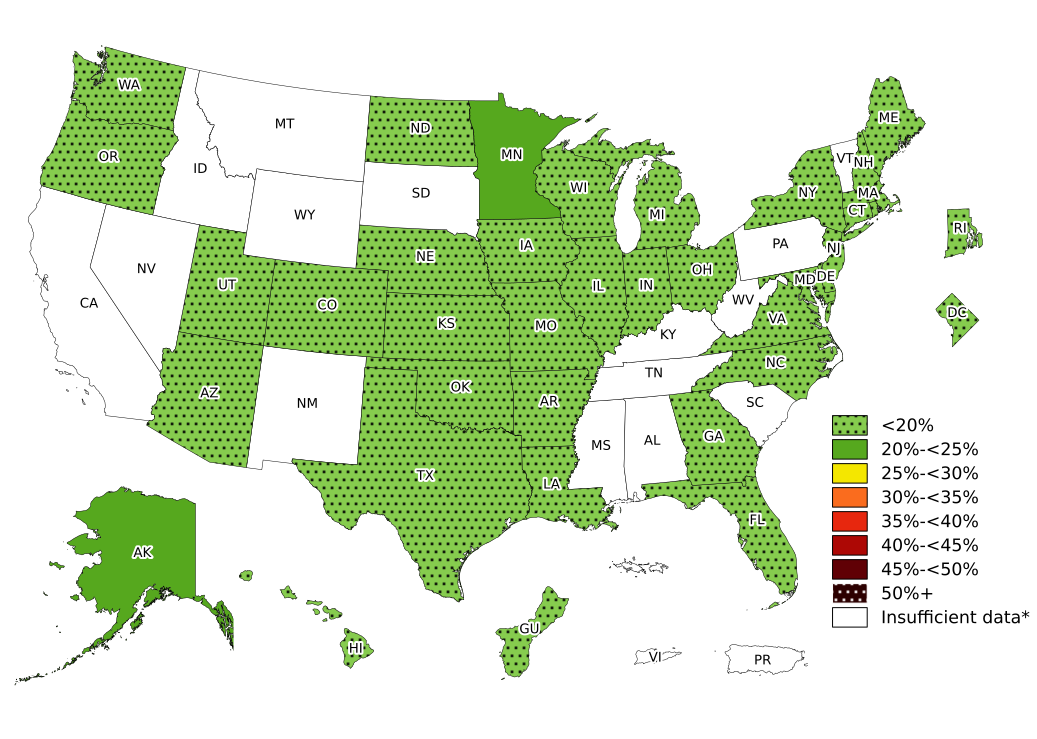
- Asian adults: 0 (among 35 states, 1 territory, and DC)
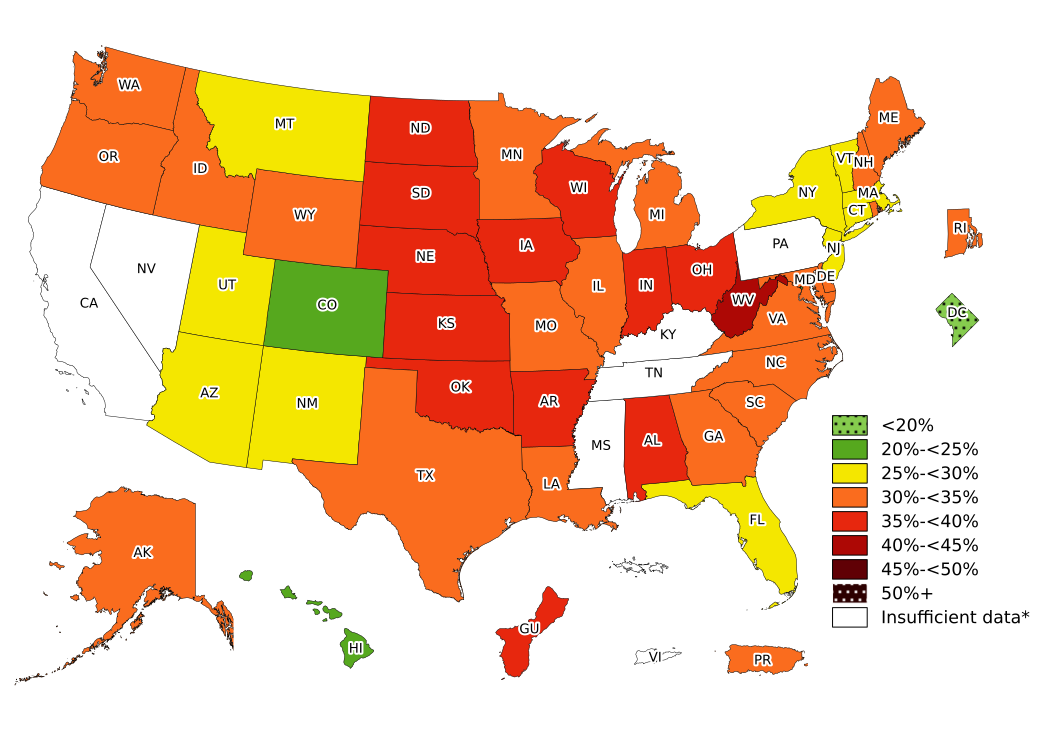
- White adults: 13 (among 44 states, 2 territories, and DC)
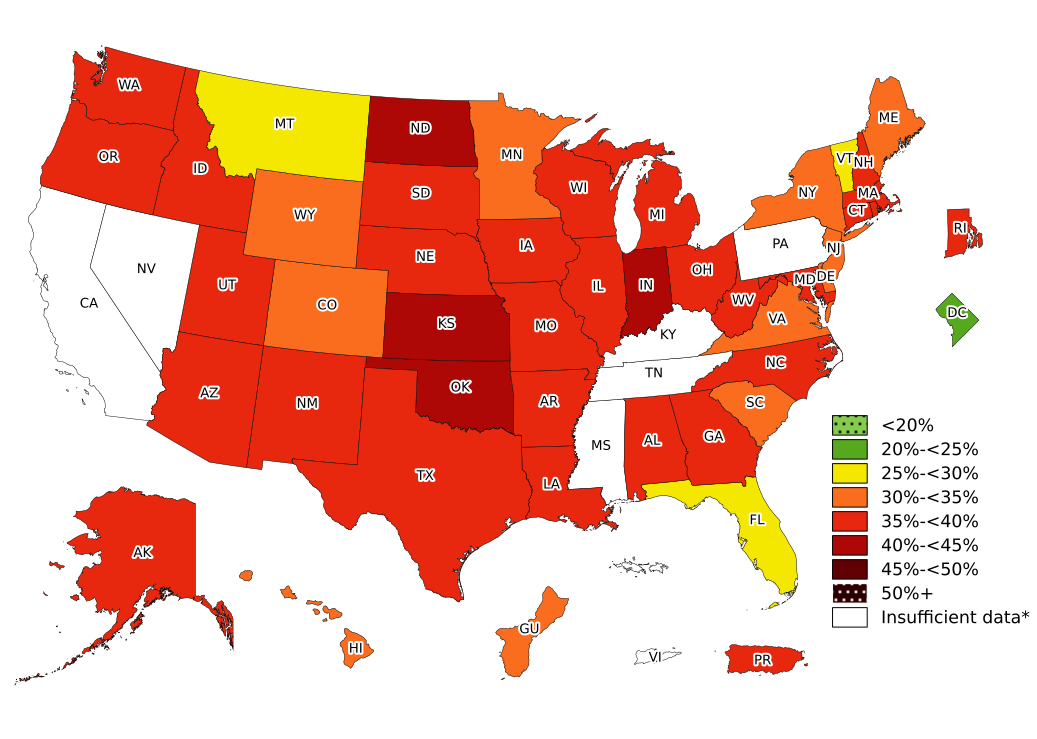
- Hispanic adults: 32 (among 44 states, 2 territories, and DC)
- Black adults: 35 (among 44 states and DC)
- American Indian or Alaska Native adults: 36 (among 44 states)
Map: Overall Obesity
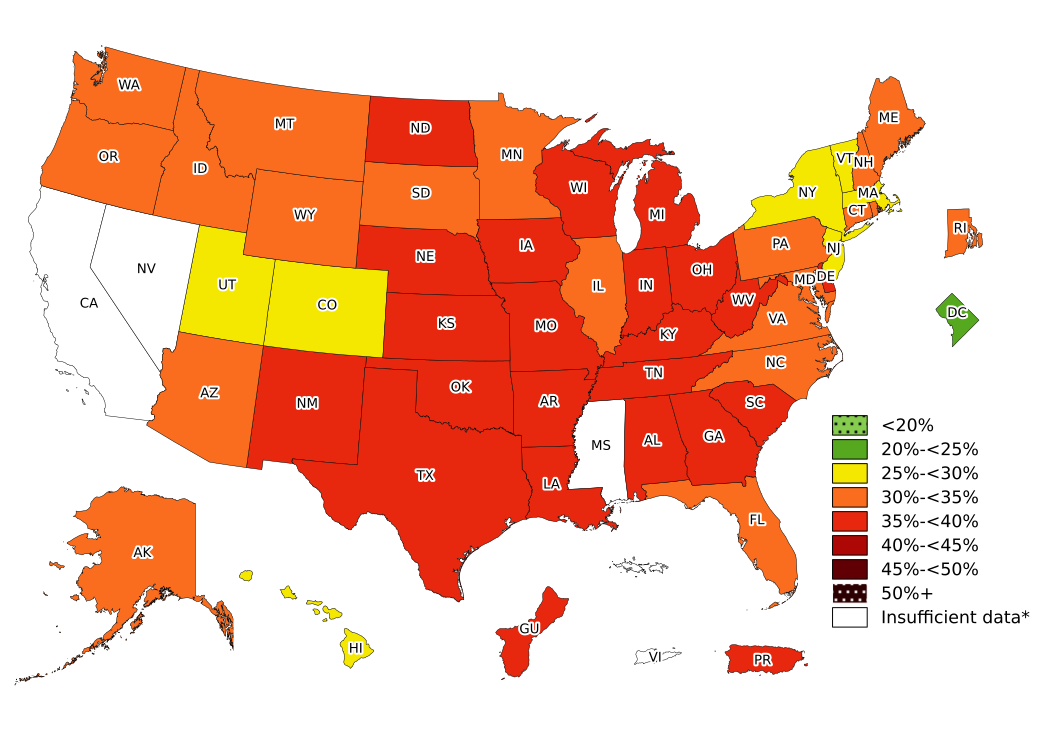
Note: Image tags are not currently exportable. This information is best viewed via the Preview URL.
Source: Behavioral Risk Factor Surveillance System
*Sample size <50, the relative standard error (dividing the standard error by the prevalence) ≥30%, or no data in a specific year.
Table: Prevalence of Obesity Based on Self-Reported Weight and Height by State and Territory, BRFSS, 2025
Adult obesity by age
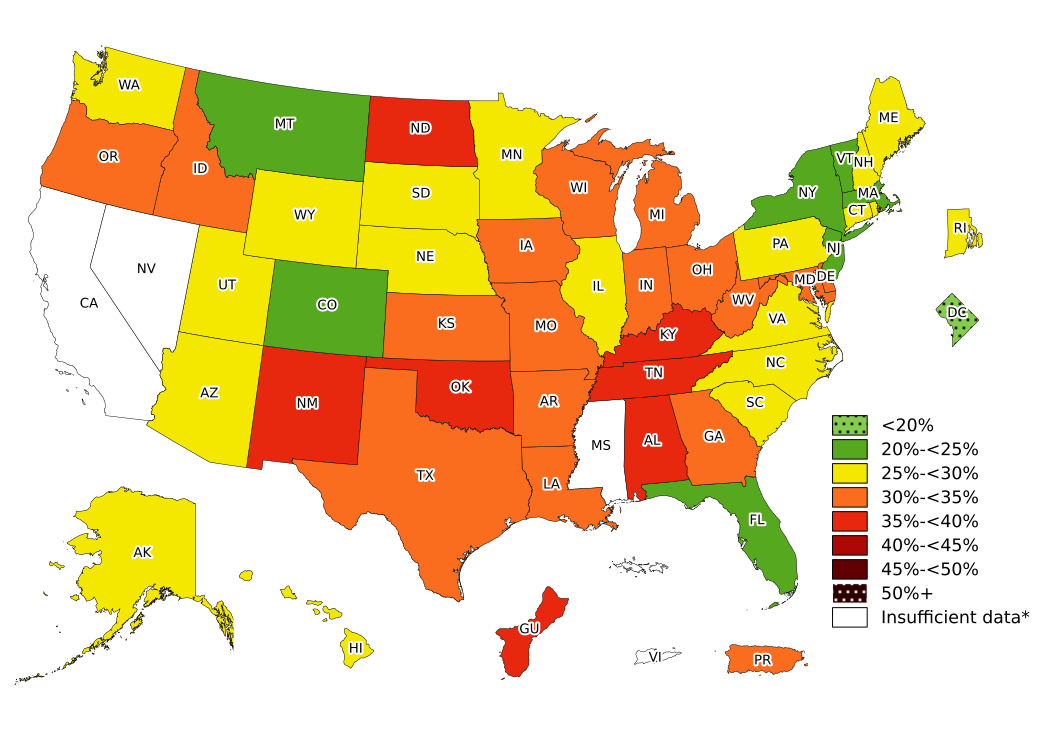
Note: Image labels (tags) are not included in exports. View them using the preview link.
Source: Behavioral Risk Factor Surveillance System
*Sample size <50, the relative standard error (dividing the standard error by the prevalence) ≥30%, or no data in a specific year.
TABLE: Prevalence of Obesity Based on Self-Reported Weight and Height Among Adults Aged 18–39 Years by State and Territory, BRFSS, 2025
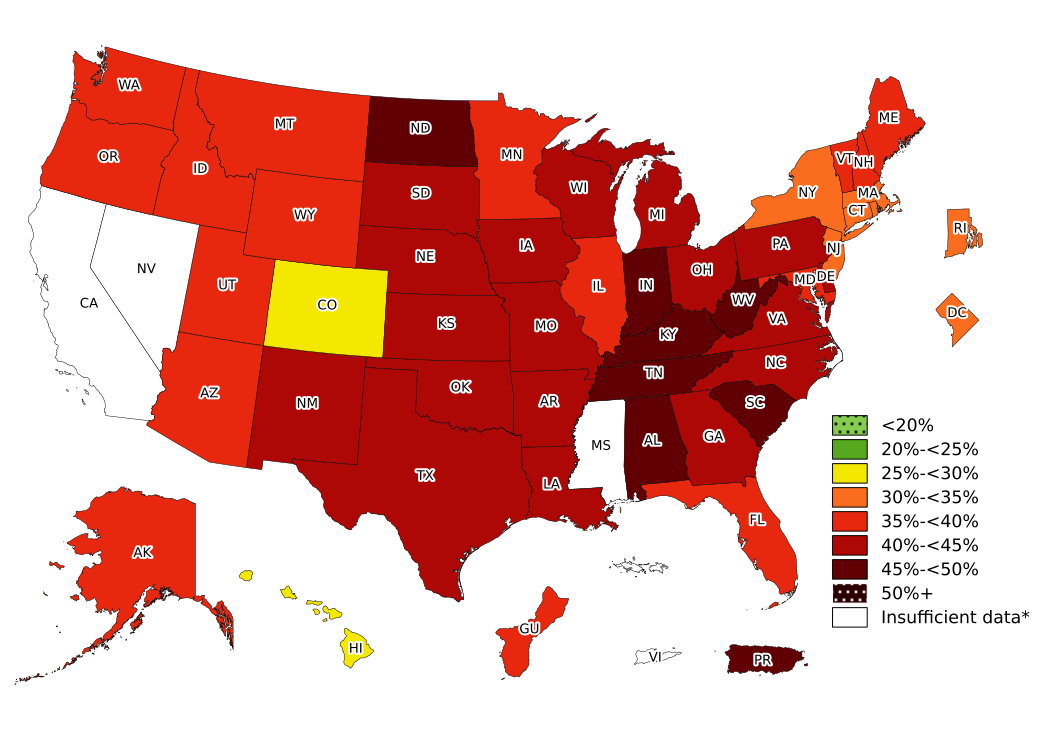
Note: Image labels (tags) are not included in exports. View them using the preview link.
Source: Behavioral Risk Factor Surveillance System
*Sample size <50, the relative standard error (dividing the standard error by the prevalence) ≥30%, or no data in a specific year.
Table: Prevalence of Obesity Based on Self-Reported Weight and Height Among Adults Aged 40–59 Years by State and Territory, BRFSS, 2025
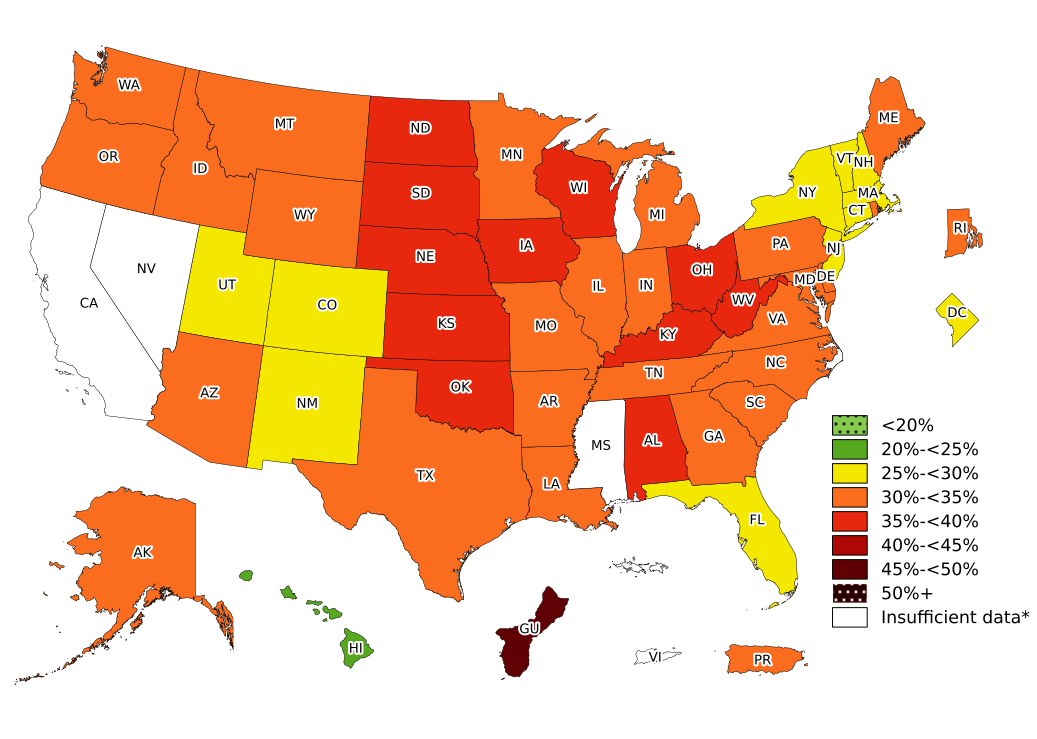
Note: Image labels (tags) are not included in exports. View them using the preview link.
Source: Behavioral Risk Factor Surveillance System
*Sample size <50, the relative standard error (dividing the standard error by the prevalence) ≥30%, or no data in a specific year.
Table: Prevalence of Obesity Based on Self-Reported Weight and Height Among Adults Aged 60 Years and Older by State and Territory, BRFSS, 2025
Obesity by race and ethnicity
Note: Image labels (tags) are not included in exports. View them using the preview link.
Source: Behavioral Risk Factor Surveillance System
*Sample size <50, the relative standard error (dividing the standard error by the prevalence) ≥30%, or no data in a specific year.
Table: Prevalence of Obesity Based on Self-Reported Weight and Height Among Non-Hispanic Asian Adults by State and Territory, BRFSS, 2023–2025.
Note: Image labels (tags) are not included in exports. View them using the preview link.
Source: Behavioral Risk Factor Surveillance System
*Sample size <50, the relative standard error (dividing the standard error by the prevalence) ≥30%, or no data in a specific year.
Table: Prevalence of Obesity Based on Self-Reported Weight and Height Among Non-Hispanic White Adults by State and Territory, BRFSS, 2023–2025.
Note: Image labels (tags) are not included in exports. View them using the preview link.
Source: Behavioral Risk Factor Surveillance System
*Sample size <50, the relative standard error (dividing the standard error by the prevalence) ≥30%, or no data in a specific year.
Table: Prevalence of Obesity Based on Self-Reported Weight and Height Among Hispanic Adults by State and Territory, BRFSS, 2023–2025.
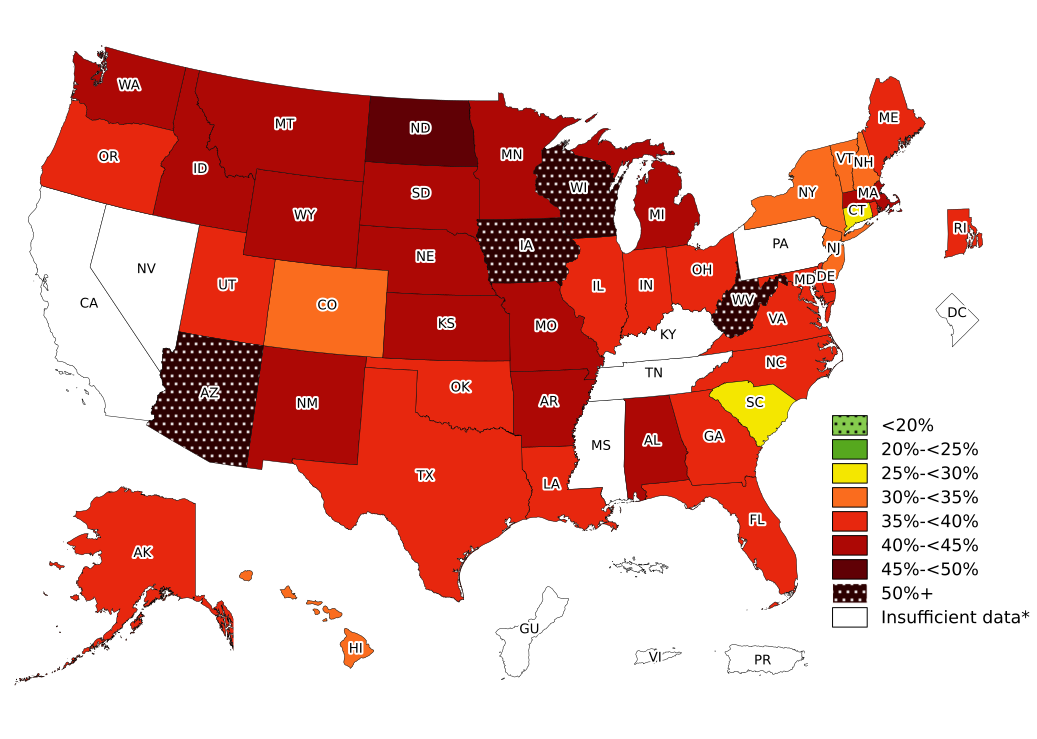
Note: Image labels (tags) are not included in exports. View them using the preview link.
Source: Behavioral Risk Factor Surveillance System
*Sample size <50, the relative standard error (dividing the standard error by the prevalence) ≥30%, or no data in a specific year.
Table: Prevalence of Obesity Based on Self-Reported Weight and Height Among Non-Hispanic American Indian or Alaska Native Adults, by State and Territory, BRFSS, 2023–2025.
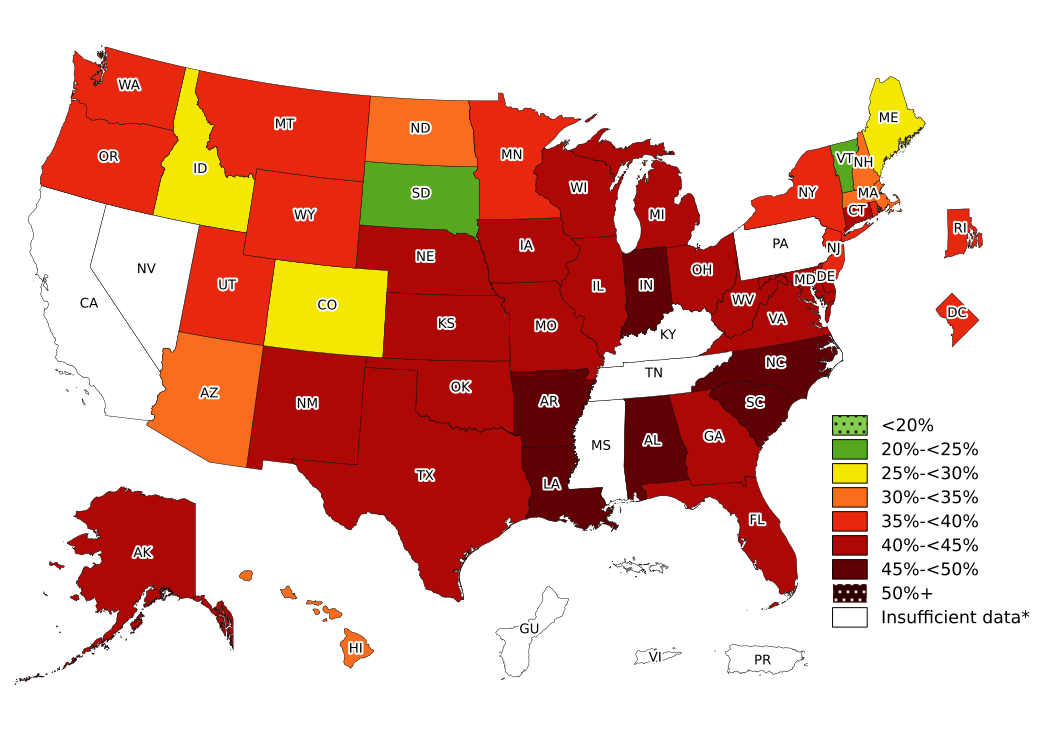
Note: Image labels (tags) are not included in exports. View them using the preview link.
Source: Behavioral Risk Factor Surveillance System
*Sample size <50, the relative standard error (dividing the standard error by the prevalence) ≥30%, or no data in a specific year.
Table: Prevalence of Obesity Based on Self-Reported Weight and Height Among Non-Hispanic Black Adults by State and Territory, BRFSS, 2023–2025.
Related Information
DNPAO Data, Trends, and Maps application
Interactive tool that provides additional obesity prevalence estimates by state and territory, as well as nutrition and physical activity indicators.
PLACES: Local Data for Better Health
Model-based population-level analysis and community estimates on obesity and other chronic disease factors for counties, census tracts, and ZIP Code Tabulation Areas (ZCTAs) across the U.S.
For more information on using respectful images and person-first language when discussing obesity and other chronic diseases, see the Guidelines for Media Portrayals of Individuals Affected by Obesity.
Download maps
Adult Obesity Age Maps by State and Territory, 2025
Adult Obesity Maps by State and Territory, 2011–2025
Adult Race/Ethnicity Obesity Maps by State and Territory, 2022–2025
Suggested citation
Centers for Disease Control and Prevention. Adult Obesity Prevalence Maps. U.S. Dept of Health and Human Services; 2026.
This page was last updated on this date. Updates may include minor edits, image changes, or other modifications to page content.
The information on this page was last reviewed by subject matter experts to ensure accuracy.