
Preventing Worker Injuries and Deaths from Traffic-Related Motor Vehicle Crashes
July 1998
DHHS (NIOSH) Publication Number 98-142
PDF Worker/Employer Summary Sheet Only
WARNING! Many workers are at high risk of injury and death from traffic-related motor vehicle crashes. About three workers die from these crashes each day.
If driving is part of your job, take the following steps:
- Use seat belts at all times. Let other workers ride with you only when the vehicle has a seat belt for each person.
- Always drive within the speed limit.
- Do not drive if you are fatigued
- Be familiar with the maintenance procedures for all vehicle systems.
If you employ motor vehicle operators, take the following steps:
- Conduct driver’s license background checks before hiring drivers.
- Provide vehicles with seat belts for the driver and every passenger, and require their use
- Establish schedules that allow drivers enough time to obey speed limits and that limit drivers’ hours of service according to regulations.
- Train drivers in safe driving practices and the proper use of vehicle safety features.
- Establish procedures to ensure proper maintenance of all vehicle systems.
- Make sure that newly purchased vehicles are equipped with appropriate occupant protection and other safety features.
- Adopt the U.S. Department of Transportation regulations for commercial motor carriers as part of your motor vehicle safety program.
If you work or employ workers who work in construction or maintenance zones, take the following steps:
- Wear or require workers to wear high-visibility clothing.
- Use or require the use of barriers and traffic control efforts when working on or near public roads.
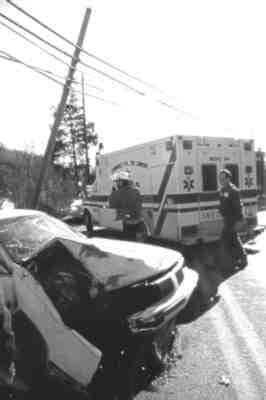
Photo by Earl Dotter(c)
Motor vehicle crashes are the leading cause of work-related fatalities.
Preventing Worker Injuries and Deaths from Traffic-Related Motor Vehicle Crashes
WARNING! Many workers are at high risk of injury and death from traffic-related motor vehicle crashes. About three workers die from these crashes each day.
The National Institute for Occupational Safety and Health (NIOSH) requests help in preventing worker deaths associated with motor vehicles. From 1980 to 1992, motor vehicle crashes were the leading cause of work-related deaths in U.S. workers. During this period, traffic-related motor vehicle crashes accounted for the deaths of 15,830 workers— or 20% of all fatal workplace injuries. Also during that period, 1,997 worker deaths were associated with motor vehicle crashes that were not related to traffic on a public highway. The number of traffic-related deaths was eight times the number not related to traffic.
This Alert examines traffic-related motor vehicle crashes that resulted in the death of a person who was at work when the incident occurred. Events that occurred while traveling to or from work are not included.
NIOSH requests your help in bringing this Alert to the attention of workers and employers. To raise the awareness of all workers who drive as part of their jobs, NIOSH also requests help from the following groups: safety and health officials, labor organizations, businesses and trade organizations, the academic and public health communities, advocacy groups, insurance companies, and other Federal agencies.
Data Sources
NIOSH data for the period 1990 through 1992 were taken from the National Traumatic Occupational Fatalities (NTOF) Surveillance System. NTOF is a death-certificate-based surveillance system composed of fatal occupational injuries to workers aged 16 and older. The NTOF data were supplemented with information from the National Highway Traffic Safety Administration (NHTSA) Fatal Accident Reporting System (FARS) for the same period. FARS, which is now called the Fatality Analysis Reporting System, is a census of fatal traffic crashes that includes data abstracted from many sources, including police records and reports from coroners and medical examiners. NTOF data were supplemented with FARS data to obtain information not included on death certificates. The actual number of fatal occupational traffic-related motor vehicle crashes from 1990 through 1992 is higher than reported in this Alert because death certificates are estimated to capture only 60% to 83% of the work-related fatalities associated with traffic-related motor vehicle crashes [Cone et al. 1991; Karlson and Baker 1978; Paulson et al. 1988; Russell and Conroy 1991].
Data Description
For the period 199092, NTOF data indicate that 3,066 workers died from motor vehicle crashes related to traffic [NIOSH 1996]. Of these worker deaths, 2,523 (82%) were successfully matched with FARS data. These deaths involved
- 2,438 events that involved at least one work-related fatality, and
- 2,104 motor vehicles occupied by at least one fatally injured worker.
The average annual fatality rate associated with motor vehicle crashes was 0.7 per 100,000 workers (note that the rates presented in this Alert are per 100,000 workers and are not calculated on the basis of miles driven).
The characteristics of the fatally injured workers, the events, and the vehicles involved are described in more detail as follows.
Fatally Injured Workers
Sex.—Of the 2,523 workers fatally injured in traffic-related motor vehicle crashes, 93% were male. The injury rate for male workers was 11 times that for female workers (1.2 compared with 0.1 per 100,000 workers).
Age.—Nearly 70% of the motor-vehicle-related fatalities occurred among workers aged 25 to 54. Workers aged 30 to 34 were involved in the highest number of fatalities (360), and workers aged 65 and older had the highest fatality rate—1.3 per 100,000 workers (Table 1).
Drivers, Passengers, and Pedestrians.—Most fatally injured workers were drivers (76%); 14% were pedestrians, and 9% were passengers.
Restraints.—Of the 2,158 fatally injured workers who were either drivers or passengers in a motor vehicle, 62% were not using any type of safety restraint. Thirteen percent used lap and shoulder belts, and nearly 5% used lap belts. Information about the type of restraint was not provided from the FARS data for 19% of these fatally injured workers.
Blood Alcohol Concentration.—Blood alcohol concentrations (BACs) were provided for 72% (1,812) of the fatally injured workers:
| BAC (g/dl) | Fatally injured workers | |
|---|---|---|
| 0 | 1,601 | (88%) |
| 0.010.09 | 79 | (4%) |
| 0.10+ (legal limit in most States) | 132 | (7%) |
Of the fatally injured drivers, 75% (1,451) had BAC results that were reported in the data:
| BAC (g/dl) | Fatally injured workers | |
|---|---|---|
| 0 | 1,269 | (87%) |
| 0.010.09 | 68 | (5%) |
| 0.10+ (legal limit in most States) | 114 | (8%) |
| Table 1. Occupational deaths from traffic-related motor vehicle crashes by age of worker, 199092 | |||
|---|---|---|---|
| Deaths | |||
| Age of worker | Number | %* | Rate† |
| 1619 | 77 | 3.1 | 0.5 |
| 2024 | 222 | 8.8 | 0.6 |
| 2529 | 306 | 12.1 | 0.7 |
| 3034 | 360 | 14.3 | 0.7 |
| 3539 | 330 | 13.1 | 0.7 |
| 4044 | 256 | 10.2 | 0.6 |
| 4549 | 271 | 10.7 | 0.8 |
| 5054 | 235 | 9.3 | 0.9 |
| 5559 | 192 | 7.6 | 0.9 |
| 6064 | 141 | 5.6 | 1.0 |
| 65+ | 133 | 5.3 | 1.3 |
| *Column does not add to 100 because of rounding.
†Rates were calculated as number of deaths per 100,000 workers per year using annual average employment data from Bureau of Labor Statistics Employment and Earnings [DOL 1991, 1992, 1993]. |
|||
Of the drivers who had BACs of 0.10 g/dl or higher,
- 33 were driving pickup trucks,
- 32 were driving tractor-trailer trucks, and
- 12 were driving 2-or 4-door sedans.
Industry and Occupation.—Of the 2,523 workers fatally injured in traffic-related motor vehicle crashes, 35% (880) worked in the transportation/communication/public utilities industry. Industry sectors with the highest number of work-related deaths from motor vehicles were establishments engaged in trucking service (689) and construction (332). Sectors with rates three or more times the overall rate of work-related deaths from motor vehicles are listed in Table 2. Trucking service establishments had a rate 17 times the average annual rate of motor vehicle fatalities for all workers.
Of the 2,523 fatally injured workers, 43% (1,091) were employed in transportation and material moving occupations. Truck drivers had the highest number of work-related deaths from motor vehicles (973). Occupations with rates four or more times the average annual rate of death (per 100,000 workers) from motor vehicles are listed in Table 3. Truck drivers had the highest rate, followed closely by garbage collectors.
Events
Of the 2,438 motor vehicle events that involved at least one work-related fatality, 1,073 (44%) involved a collision with an object other than a moving motor vehicle (Table 4). Of these 1,073 collisions, 243 (23%) involved a collision with a pedestrian.
More than half of the 2,438 motor vehicle events occurred on State highways (27%) and interstate highways (24%) (see Table 5). One-hundred and forty-seven (6%) of the 2,438 motor vehicle events occurred in a highway construction or maintenance zone; 79 (54%) of the 147 events involved pedestrians. Of the 2,438 events, 65% (1,594) occurred during daylight; 82% (1,987) occurred on dry roadways; and 85% (2,077) occurred during normal weather conditions.
Vehicles
The 2,104 motor vehicles occupied by at least one fatally injured worker were of the following types:
| Vehicle type | Number | |
|---|---|---|
| Tractor-trailer truck….. | 741 | (35%) |
| Pickup truck…………….. | 329 | (16%) |
| 2- or 4-door sedan……. | 299 | (14%) |
| Other………………………. | 735 | (35%) |
The Other category includes such vehicles as vans, farm equipment being operated on a public highway, station wagons, and compact utility vehicles.
The most harmful event* for 291 (39%) of the 741 tractor-trailer trucks was an overturn. Of the 741 tractor-trailer trucks, 125 (17%) were involved in collisions with another moving motor vehicle and 90 (12%) were involved in fires or explosions.
| Table 2. Industry sectors with the highest average annual rates of deaths from traffic-related motor vehicle crashes, 199092 | ||
|---|---|---|
| Deaths | ||
| Sector and BOC* code | Number | Rate† |
| Trucking service (410) | 689 | 12.1 |
| Logging (230) | 39 | 9.0 |
| Fuel dealers (672) | 19 | 5.6 |
| Petroleum products (552) | 24 | 5.2 |
| Agriculture crop production (010) | 124 | 4.2 |
| Sanitary service (471) | 37 | 4.1 |
| Taxicab service (402) | 13 | 3.9 |
| Farm supplies (561) | 12 | 2.9 |
| Oil and gas extraction (042) | 31 | 2.6 |
| Bus service (401) | 34 | 2.3 |
| Coal mining (041) | 9 | 2.1 |
| *Bureau of Census. Industries were classified according to the 1980 Census of Population: Alphabetical Index of Industries and Occupations [U.S. Department of Commerce 1982] and to the 1990 Census of Population and Housing: Classified Index of Industries and Occupations [U.S. Department of Commerce 1992].†Rates were calculated as number of deaths per 100,000 workers per year using employment data from the Bureau of Labor Statistics Current Population Survey [BLS 1992] microdata. Rates were not calculated for cases with insufficient information to categorize into specific industries. | ||
| Table 3. Occupations with the highest average annual rates of death from traffic-related motor vehicle crashes, 199092 | ||
|---|---|---|
| Deaths | ||
| Occupation and BOC* code | Number | Rate† |
| Truck driver (804) | 973 | 12.2 |
| Garbage collector (875) | 16 | 11.5 |
| Sheriff/bailiff (423) | 24 | 7.1 |
| Supervisor, farm worker (477) | 6 | 5.2 |
| Surveying and mapping technician (218) | 11 | 5.1 |
| Policeman/detective (418) | 70 | 4.9 |
| Taxicab driver (809) | 29 | 4.7 |
| Logging occupations (496) | 11 | 4.3 |
| Construction laborer (869) | 82 | 3.9 |
| Operating engineers (844) | 23 | 3.7 |
| *Bureau of Census. Occupations were classified according to the 1980 Census of Population: Alphabetical Index of Industries and Occupations [U.S. Department of Commerce 1982] and to the 1990 Census of Population and Housing: Classified Index of Industries and Occupations [U.S. Department of Commerce 1992].
†Rates were calculated as number of deaths per 100,000 workers per year using employment data from the Bureau of Labor Statistics Current Population Survey [BLS 1992] microdata. Rates were not calculated for cases with insufficient information to categorize into specific industries. |
||
| Table 4. Occupational deaths from traffic-related motor vehicle crashes by type, 199092 | ||
|---|---|---|
| Deaths | ||
| Type of event | Number | % total |
| Collisions with other objects | 1,073 | 44.0 |
| Pedestrian* | 243 | 22.7 |
| Guardrail | 153 | 14.3 |
| Tree | 107 | 10.0 |
| Rail train | 86 | 8.0 |
| Other | 484 | 45.1 |
| Collisions with other moving motor vehicle | 884 | 36.3 |
| Head-on | 297 | 33.6 |
| Angle | 293 | 33.1 |
| Rear-end | 237 | 26.8 |
| Other | 57 | 6.4 |
| Non-collision event | 481 | 19.7 |
| Overturn | 414 | 86.1 |
| Fell from vehicle | 35 | 7.3 |
| Other | 32 | 6.6 |
| Total | 2,438 | 100.0 |
| *Although 243 events were initiated by a motor vehicle striking a pedestrian, 345 pedestrians were fatally injured at work in the 2,438 events. | ||
| Table 5. Occupational deaths from traffic-related motor vehicle events by type of roadway, 199092 | ||
|---|---|---|
| Deaths | ||
| Type of roadway | Number | % total* |
| State highway | 657 | 27.0 |
| Interstate | 587 | 24.1 |
| U.S. highway | 487 | 20.0 |
| County road | 380 | 15.6 |
| Municipality | 177 | 7.3 |
| Township | 75 | 3.1 |
| Other | 69 | 2.8 |
| Unknown | 6 | 0.3 |
| Total | 2,438 | 100.0 |
| *Column does not add to 100 because of rounding. | ||
The 331 motor vehicles that struck a pedestrian were of the following types:
| Vehicle type | Number | |
|---|---|---|
| 2- to 4-door sedan….. | 123 | (37%) |
| Tractor-trailer truck………… | 48 | (15%) |
| Pickup truck | 45 | (14%) |
| Other………………………. | 115 | (35%) |
Current Regulations
Two Federal agencies hold the primary responsibility for setting and enforcing motor vehicle standards: the Federal Highway Administration (FHWA) and NHTSA.
FHWA
The FHWA under the U.S. Department of Transportation regulates and enforces Federal requirements relating to the safe operation and equipment for commercial motor carriers under 49 CFR† 350399 as follows:
- All commercial motor vehicle operators shall be required to have a single commercial motor vehicle driver’s license [49 CFR 383.23(a)(2)].
- Drivers shall not operate a commercial motor vehicle while the driver’s ability or alertness is so impaired, or so likely to become impaired, through fatigue, illness, or any other cause, as to make it unsafe for him/her to begin or continue to operate the commercial motor vehicle [49 CFR 392.3].
- Drivers shall not be on duty and possess, be under the influence of, or use any controlled drug or substance, including any amphetamines, narcotic drugs, or any other substance that renders the driver incapable of safely operating a commercial motor vehicle. This does not apply to any substance administered by a physician who has advised the driver that the substance will not affect the driver’s ability to safely operate a commercial motor vehicle [49 CFR 392.4].
- Drivers shall not be under the influence of alcohol or possess an alcoholic beverage while on duty [49 CFR 392.5].
- Motor carriers shall not schedule a run nor permit nor require the operation of any commercial motor vehicle between points in such period of time as would necessitate the commercial motor vehicle being operated at speeds greater than those prescribed [49 CFR 392.6].
- Commercial motor vehicles shall not be driven unless the driver thereof has satisfied himself or herself that all parts and accessories are in good working order [49 CFR 392.7].
- A commercial motor vehicle that has a seat belt assembly installed at the driver’s seat shall not be driven unless the driver has properly restrained himself or herself with the seat belt assembly [49 CFR 392.16].
- Commercial motor vehicle operators must comply with the maximum driving and on-duty time as set forth by 49 CFR 395.3(a)-(b), which defines acceptable patterns of consecutive driving and off-duty hours.
NHTSA
The NHTSA (also under the U.S. Department of Transportation) is responsible for setting and enforcing safety performance and use standards for motor vehicle equipment under 49 CFR 500599. These standards pertain to all vehicles manufactured in the United States. The Administration also sets and enforces safety standards to ensure that motor vehicles and motor vehicle equipment imported into the United States conform with all Federal motor vehicle safety standards. All vehicles purchased should be equipped with appropriate crash protection for occupants, as prescribed by 49 CFR 571.208.
Other Regulations
FHWA and NHTSA also have responsibilities in areas other than regulating motor carriers, drivers, and vehicle regulatory issues. NHTSA and the FHWA Office of Motor Carriers are responsible for overseeing State-sponsored or -conducted education and enforcement activities. In addition, all States and local communities have programs that can affect the work environment (i.e., the streets and roads). Components of the Child Labor Requirements Under the Fair Labor Standards Act and certain Occupational Safety and Health Administration (OSHA) regulations (for example, those for logging and construction) also address the safe operation of motor vehicles for particular populations or settings.
Conclusions
Traffic-related motor vehicle crashes are the leading cause of work-related injury death. They reduce our workforce by more than three workers each day. However, the environment in which these crashes occur is complex and may not be as controllable as other workplaces. Uncontrollable factors include aggressive or impaired drivers and motorists who ignore the dangers of sharing the road with commercial vehicles (for example, those who do not allow enough room for a truck to turn a corner).
Although the data reported here help us understand the magnitude and circumstances of U.S. worker deaths from traffic-related motor vehicle crashes, many factors remain unclear. Furthermore, because data are not available for total miles driven and miles driven classified by industry, occupation, season, and geographic location, the rates presented here per 100,000 workers may not accurately reflect the risk among worker groups.
Government and public safety organizations have long studied ways to prevent injuries from motor vehicle crashes. But researchers have paid little attention to preventing work-related motor vehicle crashes. Prevention efforts must be emphasized to reduce the number and rate of occupational fatalities involving motor vehicles.
Injury prevention and control technologies such as safety belts, air bags, daytime running lights, and vehicle design were developed to improve public safety; but they may also be applicable to workers whose jobs involve driving or travel by motor vehicles [CDC 1994]. Prevention efforts should include a combination of education, enforcement, and engineering controls. Companies with large fleets of motor vehicles can provide unique opportunities for researchers to study injury prevention strategies to begin answering the many remaining questions about risk factors and effective methods of injury prevention.
Recommendations
Companies must rely on their own experience when establishing safety procedures. Any employer who is developing and implementing a comprehensive traffic safety program for the workplace must gather and analyze internal data so that the company’s program targets the problems that will reduce the crashes, deaths, and injuries. The recommendations presented here highlight the issues to keep in mind when developing these safety programs. NIOSH recommends that employers take the following measures to prevent traffic-related deaths and injuries of workers from motor vehicle crashes:
- Conduct driver’s license background checks on prospective drivers before they are hired.
- Establish a written policy requiring drivers and passengers to use seat belts at all times. Make sure that employees are aware of and comply with this written policy.
- Provide a seat belt for the driver and each passenger in all employer-provided vehicles. Limit the number of passengers permitted in a vehicle to the number of seat belts available.
- Ensure that drivers comply with designated speed limits in all construction and maintenance zones and on all other roadways.
- Establish schedules that allow drivers to obey speed limits and limit their hours of service according to regulations. Do not permit workers to drive while fatigued or to exceed posted speed limits.
- Ensure that all employees in construction and maintenance zones wear high-visibility clothing [NIOSH 1994].
- Ensure that workers use appropriate barriers and traffic control efforts while work is being performed on the sides of roadways normally open to the public.
- Train drivers in safe driving practices and proper use of vehicle safety features. Make sure that this training is performance-based and periodically repeated.
- Establish written procedures to ensure the proper maintenance of all vehicle systems.
- Make sure that newly purchased vehicles are equipped with appropriate occupant protection such as shoulder and lap belts and air bags. Equip new vehicles with other safety features such as antilock brakes and daytime running lights where appropriate and feasible.
- Consider adopting U.S. Department of Transportation regulations for commercial motor carriers as part of your motor vehicle safety programs. Many of these regulations provide guidance on company policies for other vehicle types and other groups of drivers.
NIOSH recommends that researchers thoroughly evaluate existing and proposed prevention strategies and further investigate the causes and circumstances of work-related motor vehicle crashes. Research areas include the following:
- Classifying work-related miles driven by industry and occupation to identify industries and occupations at highest risk and risk variations by season, time of day, and State
- Studying issues such as the optimal use of training and communication strategies to improve knowledge of and compliance with safety regulations by workers and employers
- Determining whether existing regulations should be enforced more consistently or whether new regulations are required to reduce the number of worker deaths associated with motor vehicles
- Assessing the efficacy of vehicle maintenance plans and work zone designs
- Collecting and analyzing detailed data on the causes of work-related motor vehicle crashes to target effectively the most appropriate areas for intervention efforts
- Determining the need for improved commercial vehicle design (such as improved occupant protection systems for heavy trucks and other commercial vehicles).
Acknowledgements
Suzanne M. Kisner from the NIOSH Division of Safety Research and E. Lynn Jenkins from the NIOSH Office of the Director were the principal contributors to this Alert. Comments or questions concerning this Alert should be directed to Director, Division of Safety Research, National Institute for Occupational Safety and Health, Morgantown, WV 265052888; telephone, (304) 2855894. We greatly appreciate your assistance in protecting the lives of American workers.
Linda Rosenstock, M.D., M.P.H.
Director, National Institute for
Occupational Safety and Health
Centers for Disease Control and Prevention
References
BLS [1992]. Labor force, employment, and unemployment from the current population survey. In: BLS Handbook of Methods. Washington, DC: U.S. Department of Labor, Bureau of Labor Statistics, pp. 312.
C
DC (Centers for Disease Control and Prevention) [1994]. Occupational injury deaths–United States, 19801989. MMWR 43(14):262264.
CFR. Code of Federal regulations. Washington, DC: U.S. Government Printing Office, Office of the Federal Register.
Cone JE, Daponte A, Makofsky D, Reiter R, Becker C, Harrison RJ, et al. [1991]. Fatal injuries at work in California. J Occup Med 33(7):813817.
DOL (U.S. Department of Labor, Bureau of Labor Statistics) [1991]. Annual averages. Employment and earnings 38(1):162163.
DOL (U.S. Department of Labor, Bureau of Labor Statistics) [1992]. Annual averages. Employment and earnings 39(1):172173.
DOL (U.S. Department of Labor, Bureau of Labor Statistics) [1993]. Annual averages. Employment and earnings 40(1):162163.
Karlson TA, Baker SP [1978]. Fatal occupational injuries associated with motor vehicles. Proceedings of the 22nd Conference of the American Association for Automotive Medicine. Vol. 1. Arlington Heights, IL: American Association for Automotive Medicine, pp. 229241.
NIOSH [1994]. Tree trimmer foreman dies after being struck by a pickup truck–South Carolina. Morgantown, WV: U.S. Department of Health and Human Services, Public Health Service, Centers for Disease Control and Prevention, National Institute for Occupational Safety and Health, Fatality Assessment and Control Evaluation (FACE) Report No. 9407.
NIOSH [1996]. National Traumatic Occupational Fatalities (NTOF) Surveillance System. Morgantown, WV: U.S. Department of Health and Human Services, Public Health Service, Centers for Disease Control and Prevention, National Institute for Occupational Safety and Health. Unpublished database.
Paulson KM, Marine WM, Weiser JK, Keefer SM [1988]. Colorado population-based occupational injury and fatality surveillance system report, 19821984. Denver, CO: Colorado Department of Health.
Russell J, Conroy C [1991]. Representativeness of deaths identified through the injury-at-work item on the death certificate: implications for surveillance. Am J Public Health 81(12):16131618.
U.S. Department of Commerce [1982]. 1980 Census of population: alphabetical index of industries and occupations. Final ed. Washington, DC: U.S. Department of Commerce, Bureau of the Census, PHC80R3.
U.S. Department of Commerce [1992]. 1990 Census of population and housing: classified index of industries and occupations. Washington, DC: U.S. Department of Commerce, Bureau of the Census, CPHR4.
*The most harmful event is defined in FARS as the event during a crash that produces the greatest personal injury or property damage.
†Code of Federal Regulations. See CFR in references.
DISCLAIMER: Mention of any company or product does not constitute endorsement by the National Institute for Occupational Safety and Health.