


What to know
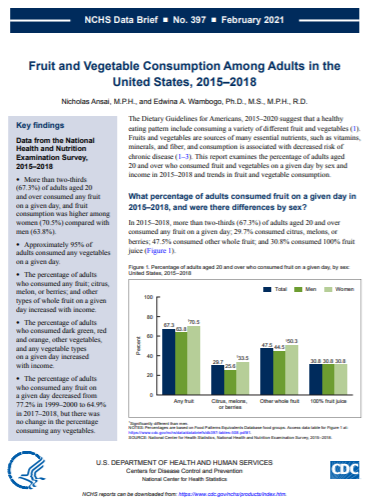
A new NCHS report examines the percentage of adults aged 20 and over who consumed fruit and vegetables on a given day by sex and income in 2015–2018 and trends in fruit and vegetable consumption.
Get the data story
A new NCHS report examines the percentage of adults aged 20 and over who consumed fruit and vegetables on a given day by sex and income in 2015–2018 and trends in fruit and vegetable consumption.
Key Findings:
- More than two-thirds (67.3%) of adults aged 20 and over consumed any fruit on a given day, and fruit consumption was higher among women (70.5%) compared with men (63.8%).
- Approximately 95% of adults consumed any vegetables on a given day.
- The percentage of adults who consumed any fruit; citrus, melon, or berries; and other types of whole fruit on a given day increased with income.
- The percentage of adults who consumed dark green, red and orange, other vegetables, and any vegetable types on a given day increased with income.
- The percentage of adults who consumed any fruit on a given day decreased from 77.2% in 1999–2000 to 64.9% in 2017–2018, but there was no change in the percentage consuming any vegetables.
Content Source:
National Center for Health Statistics