


What to know
A new NCHS report released today shows the percentage of U.S. adults who, on a given day, were on any special diet and specific types of special diets in 2015–2018 and trends from 2007–2008 through 2017–2018.

Get the data story
A new NCHS report released today shows the percentage of U.S. adults who, on a given day, were on any special diet and specific types of special diets in 2015–2018 and trends from 2007–2008 through 2017–2018.
Key Findings:
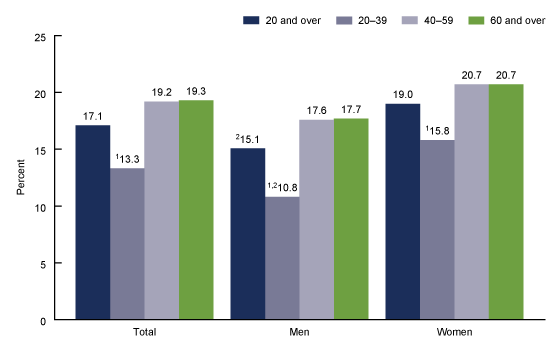
- In 2015–2018, 17.1% of U.S. adults aged 20 and over were on a special diet on a given day.
- More women were on a special diet than men, and more adults aged 40–59 and 60 and over were on a special diet than adults aged 20–39.
- More non-Hispanic white adults (17.8%) were on a special diet than non-Hispanic black (14.7%) and non-Hispanic Asian (14.9%) adults.
- The most common type of special diet reported among all adults was a weight loss or low-calorie diet.
- From 2007–2008 through 2017–2018, the percentage of adults on any special diet, weight loss or low-calorie diets, and low carbohydrate diets increased, while the percentage of adults on low-fat or low-cholesterol diets decreased.
Content Source:
National Center for Health Statistics