


What to know

Summary
A data story from the National Center for Health Statistics
Authors: Merianne R. Spencer, MPH; Holly Hedegaard, MD; and Matthew Garnett, MPH
Get the data story
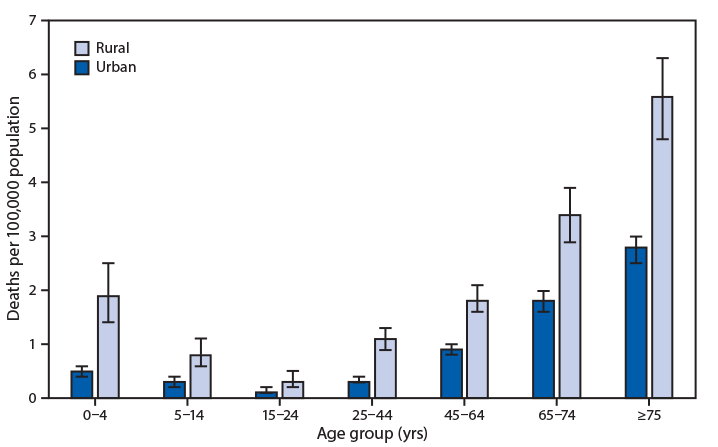
In 2018, the death rates attributed to unintentional injury from fire or flames were lowest among those aged 15–24 years and highest among those aged 75 years or older.
In rural areas, death rates decreased with age from 2.0 per 100,000 for persons aged 0–4 years to 0.3 for those aged 15–24 years, and then increased with age to 5.6 for those aged 75 years or older.
The pattern was similar for urban areas, where rates were 0.5 per 100,000 for persons aged 0–4 years, decreased to 0.1 for those aged 15–24 years, and then increased with age to 2.8 for those aged 75 years or older.
Across all age groups, death rates were approximately two to four times higher in rural areas compared with urban areas.
https://www.cdc.gov/mmwr/volumes/69/wr/mm6934a8.htm
Source: National Center for Health Statistics, National Vital Statistics System, mortality data; 2018. https://www.cdc.gov/nchs/nvss/deaths.htm.