Learn about the history, vision, and mission of CDC's Environmental Public Health Tracking Program.

An alphabetical list of environmental and health data topics on CDC's Tracking Network
Better Information for Better Health
Program profiles of 33 state and local health departments funded by the Tracking Program.
Tools & Resources
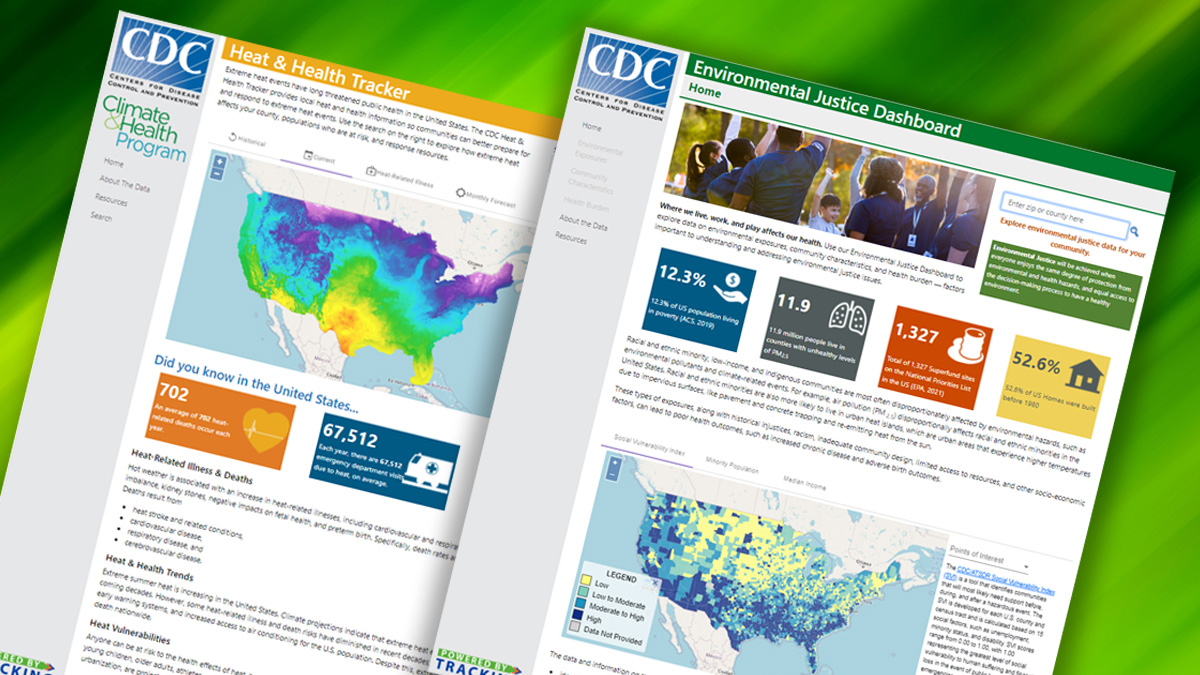
Access data dashboards to learn more about important issues that affect environmental health.

Tracking Program efforts to modernize environmental public health data.
Learn about Tracking Geographies data and resources and how to use them.