Welcome to the Community Counts Data Visualization Tool

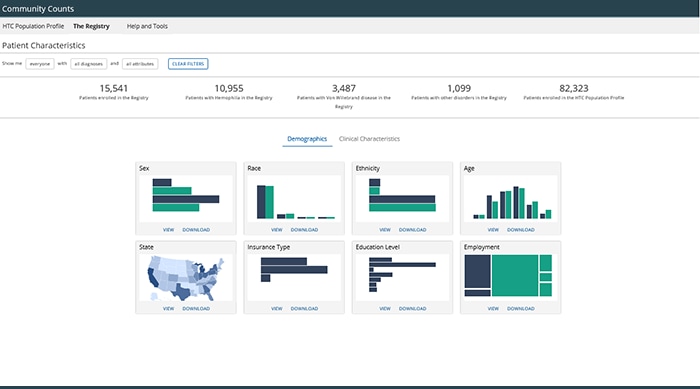
The Community Counts data visualization tool displays de-identified data on patients with bleeding disorders who are enrolled in Community Counts in a new interactive, visual format. This tool can be used by clinicians, patients, and policymakers to learn more about the burden of bleeding disorders in the United States.

Access the Community Counts data visualization tool.
