Demographics and Healthcare Utilization Data, Georgia, 2018
The Sickle Cell Data Collection (SCDC) program monitors and reports on the health of people with sickle cell disease (SCD) over time. Georgia’s Demographics and Healthcare Utilization Data are available for each year from 2010 through 2018. They provide information about the number of people with SCD in the state, their emergency department (ED) visits, and their hospitalizations during a particular year.

The Bloodline is a quarterly newsletter that provides updates about the SCDC program. Click here to read past newsletters, and subscribe to the newsletter to stay updated on the SCDC program’s health communications activities, data, presentations, and more.
The people included in the 2018 data met at least one of the following criteria:
- Born in 2018 and reported by the state newborn screening program with a confirmed diagnosis of SCD
- Born prior to 2018 and reported by the state newborn screening program with a confirmed diagnosis of SCD and at least one of the following criteria:
- Hospital discharge or ED utilization during 2018 or before and after 2018
- Enrollment in the Georgia Medicaid program during 2018 or before and after 2018
- Received care at one of the state’s clinical sites providing data to SCDC and a laboratory-confirmed diagnosis of SCD and at least one of the following criteria:
- Received care at the clinical site during 2018 or after 2018
- Hospital discharge or ED utilization during 2018 or before and after 2018
- Enrollment in the Georgia Medicaid program during 2018 or before and after 2018
- The clinical sites that are providing data to the SCDC program are:
- Augusta University Sickle Cell Center
- Sickle Cell Disease Program at Children’s Healthcare of Atlanta
- Georgia Comprehensive Sickle Cell Center at Grady Memorial Hospital
- Pediatric hematology/oncology at Memorial Health Dwaine and Cynthia Willett Children’s Hospital of Savannah
- Three or more healthcare visits (hospital, ED, or outpatient) with an SCD ICD-9-CM (through September 30, 2015) or ICD-10-CM (after October 1, 2015) code over any 5-year period between January 1, 2004–December 31, 2019, and at least one of the following criteria:
- Hospital discharge or ED utilization during 2018 or before and after 2018
- Enrollment in the Georgia Medicaid program during 2018 or before and after 2018
- Age: age on December 31, 2018
- Hospital admissions: direct hospital admissions or hospital admissions that originated in the ED
- 30-day hospital readmissions: hospital or ED readmission within 30 days of discharge from the initial hospital admission
- ED visits: ED visits that resulted in a release after treatment
- 30-day ED readmissions: hospital or ED readmission within 30 days of discharge from the initial ED visit
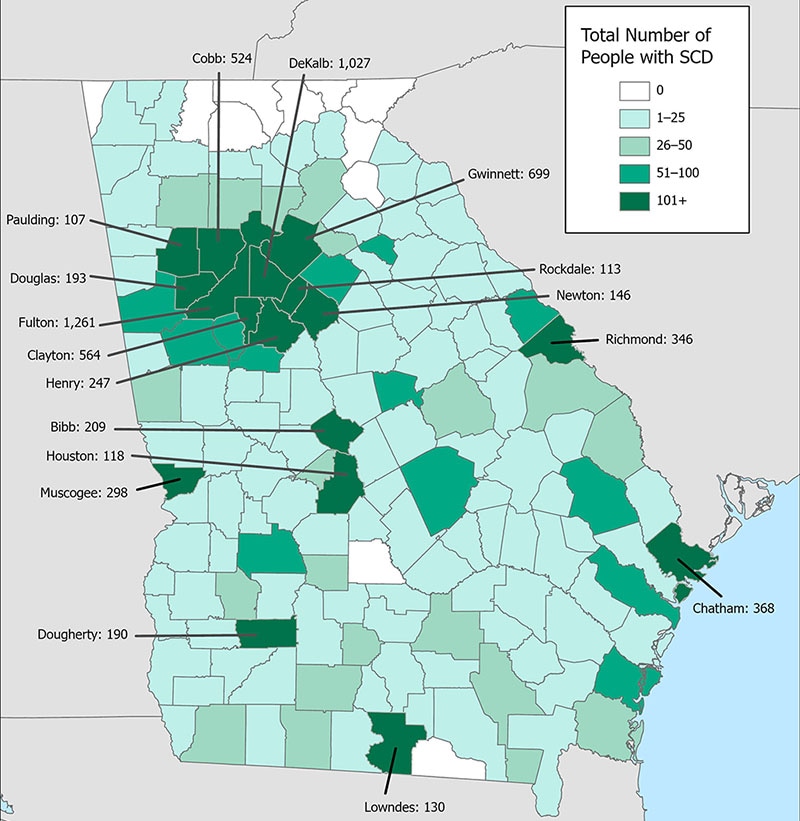
Map 1: More than 90% of the counties in Georgia had at least one person with SCD in 2018. Forty-five percent of the people with SCD who lived in Georgia resided in five counties (Clayton, Cobb, Dekalb, Fulton, or Gwinnett).
| County | Total Number of people with SCD |
|---|---|
| Appling | 1–25 |
| Atkinson | 1–25 |
| Bacon | 1–25 |
| Baker | 1–25 |
| Baldwin | 51–100 |
| Barrow | 26–50 |
| Bartow | 26–50 |
| Ben Hill | 1–25 |
| Berrien | 1–25 |
| Bibb | 209 |
| Bleckley | 1–25 |
| Brantley | 1–25 |
| Brooks | 1–25 |
| Bryan | 1–25 |
| Bulloch | 51–100 |
| Burke | 26–50 |
| Butts | 1–25 |
| Calhoun | 1–25 |
| Camden | 26–50 |
| Candler | 1–25 |
| Carroll | 51–100 |
| Catoosa | 1–25 |
| Charlton | 1–25 |
| Chatham | 368 |
| Chattahoochee | 1–25 |
| Chattooga | 1–25 |
| Cherokee | 26–50 |
| Clarke | 51–100 |
| Clay | 1–25 |
| Clayton | 564 |
| Clinch | 1–25 |
| Cobb | 524 |
| Coffee | 26–50 |
| Colquitt | 26–50 |
| Columbia | 51–100 |
| Cook | 1–25 |
| Coweta | 51–100 |
| Crawford | 1–25 |
| Crisp | 26–50 |
| Dawson | 1–25 |
| Decatur | 26–50 |
| Dekalb | 1027 |
| Dodge | 1–25 |
| Dooly | 1–25 |
| Dougherty | 190 |
| Douglas | 193 |
| Early | 1–25 |
| Effingham | 1–25 |
| Elbert | 1–25 |
| Emanuel | 1–25 |
| Evans | 1–25 |
| Fayette | 51–100 |
| Floyd | 1–25 |
| Forsyth | 26–50 |
| Franklin | 1–25 |
| Fulton | 1261 |
| Glascock | 1–25 |
| Glynn | 51–100 |
| Gordon | 1–25 |
| Grady | 1–25 |
| Greene | 1–25 |
| Gwinnett | 699 |
| Hall | 26–50 |
| Hancock | 1–25 |
| Haralson | 1–25 |
| Harris | 1–25 |
| Hart | 1–25 |
| Heard | 1–25 |
| Henry | 247 |
| Houston | 118 |
| Irwin | 1–25 |
| Jackson | 1–25 |
| Jasper | 1–25 |
| Jeff Davis | 1–25 |
| Jefferson | 1–25 |
| Jenkins | 1–25 |
| Johnson | 1–25 |
| Jones | 1–25 |
| Lamar | 1–25 |
| Lanier | 1–25 |
| Laurens | 51–100 |
| Lee | 1–25 |
| Liberty | 51–100 |
| Lincoln | 1–25 |
| Long | 1–25 |
| Lowndes | 130 |
| Lumpkin | 1–25 |
| Macon | 1–25 |
| Madison | 1–25 |
| Marion | 1–25 |
| McDuffie | 1–25 |
| McIntosh | 1–25 |
| Meriwether | 1–25 |
| Miller | 1–25 |
| Mitchell | 1–25 |
| Monroe | 1–25 |
| Montgomery | 1–25 |
| Morgan | 1–25 |
| Muscogee | 298 |
| Newton | 146 |
| Oconee | 1–25 |
| Oglethorpe | 1–25 |
| Paulding | 107 |
| Peach | 26–50 |
| Pickens | 1–25 |
| Pierce | 1–25 |
| Pike | 1–25 |
| Polk | 1–25 |
| Pulaski | 1–25 |
| Putnam | 1–25 |
| Quitman | 1–25 |
| Randolph | 1–25 |
| Richmond | 346 |
| Rockdale | 113 |
| Schley | 1–25 |
| Screven | 26–50 |
| Seminole | 1–25 |
| Spalding | 51–100 |
| Stephens | 1–25 |
| Stewart | 1–25 |
| Sumter | 51–100 |
| Talbot | 1–25 |
| Taliaferro | 1–25 |
| Tattnall | 1–25 |
| Taylor | 1–25 |
| Telfair | 1–25 |
| Terrell | 26–50 |
| Thomas | 26–50 |
| Tift | 26–50 |
| Toombs | 1–25 |
| Treutlen | 1–25 |
| Troup | 26–50 |
| Turner | 1–25 |
| Twiggs | 1–25 |
| Upson | 1–25 |
| Walker | 1–25 |
| Walton | 51–100 |
| Ware | 26–50 |
| Warren | 1–25 |
| Washington | 26–50 |
| Wayne | 1–25 |
| Webster | 1–25 |
| Wheeler | 1–25 |
| White | 1–25 |
| Whitfield | 1–25 |
| Wilkes | 1–25 |
| Wilkinson | 1–25 |
| Worth | 1–25 |
| All other counties | 0 |
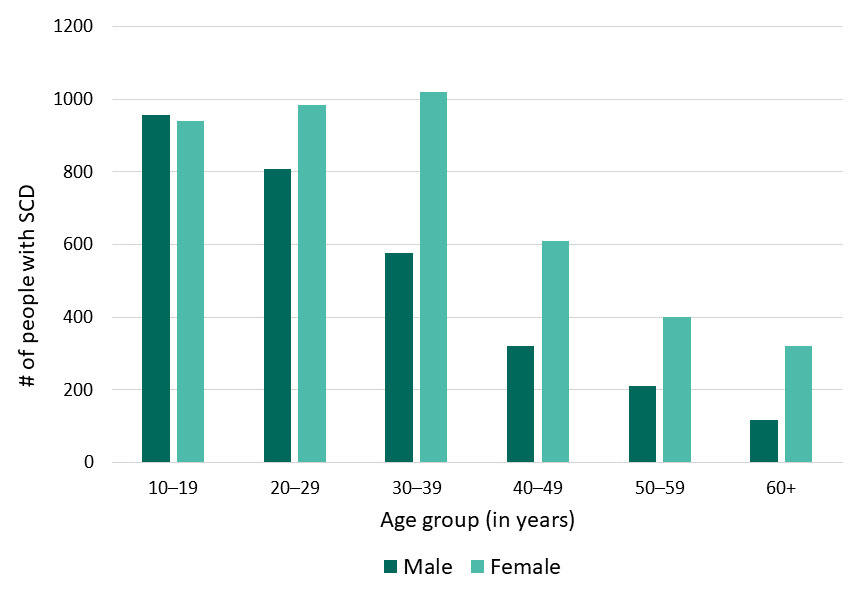
Figure 1: There were more than 9,000 people with SCD living in Georgia in 2018. More than 20% of them were 40 years old or older.
| Age group (in years) | Male | Female |
|---|---|---|
| <10 | 958 | 921 |
| 10–19 | 956 | 939 |
| 20–29 | 808 | 984 |
| 30–39 | 576 | 1,020 |
| 40–49 | 321 | 609 |
| 50–59 | 210 | 400 |
| 60+ | 117 | 322 |
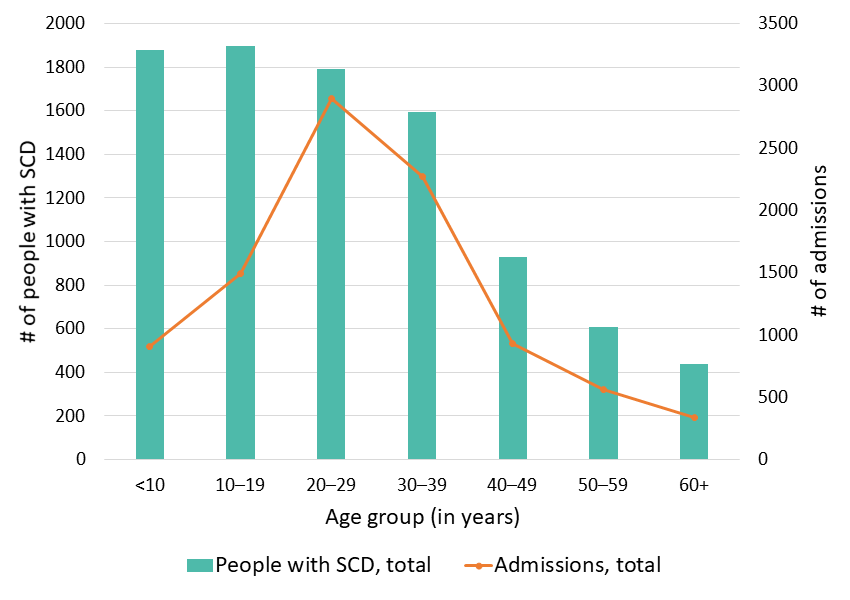
Figure 2: People with SCD living in Georgia in 2018 had a total of almost 9,500 hospital admissions.
| Age group (in years) | People with SCD, total | Admissions, total |
|---|---|---|
| <10 | 1,879 | 906 |
| 10–19 | 1,895 | 1,492 |
| 20–29 | 1,792 | 2,900 |
| 30–39 | 1,596 | 2,274 |
| 40–49 | 930 | 935 |
| 50–59 | 610 | 561 |
| 60+ | 439 | 338 |
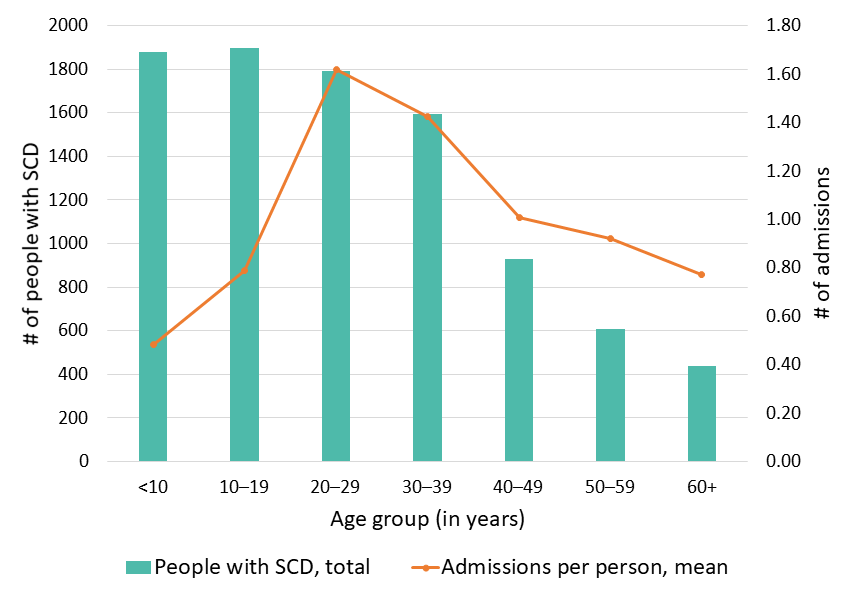
Figure 3: The average number of hospitalizations for people with SCD living in Georgia in 2018 was highest for 20- to 29-year-olds (1.6 hospitalizations) and lowest for <10-year-olds (0.5 hospitalizations).
| Age group (in years) | People with SCD, total | Admissions per person, mean |
|---|---|---|
| <10 | 1,879 | 0.48 |
| 10–19 | 1,895 | 0.79 |
| 20–29 | 1,792 | 1.62 |
| 30–39 | 1,596 | 1.42 |
| 40–49 | 930 | 1.01 |
| 50–59 | 610 | 0.92 |
| 60+ | 439 | 0.77 |
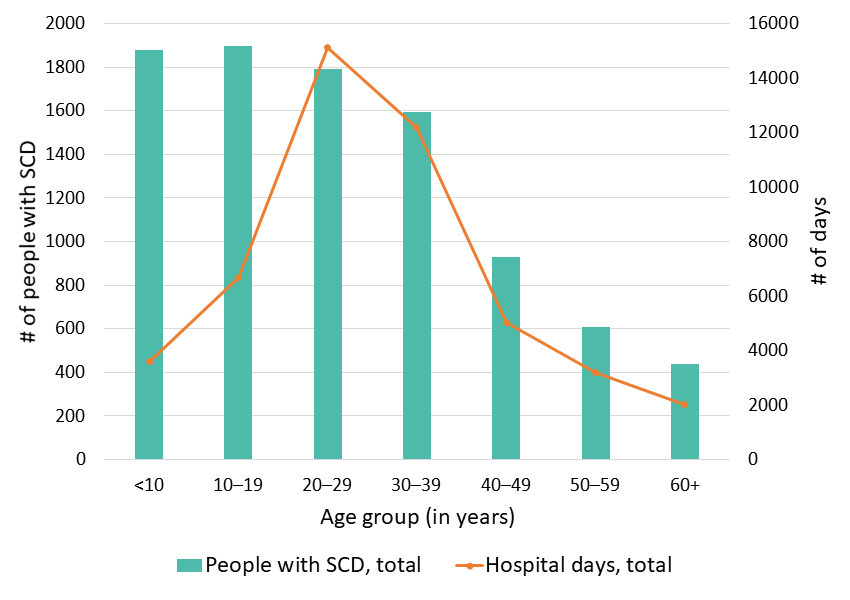
Figure 4: People with SCD living in Georgia in 2018 spent a total of almost 48,000 days in the hospital.
| Age group (in years) | Patients, total | Hospital Days, total |
|---|---|---|
| <10 | 1,879 | 3,596 |
| 10–19 | 1,895 | 6,693 |
| 20–29 | 1,792 | 15,133 |
| 30–39 | 1,596 | 12,176 |
| 40–49 | 930 | 5,035 |
| 50–59 | 610 | 3,205 |
| 60+ | 439 | 2,035 |
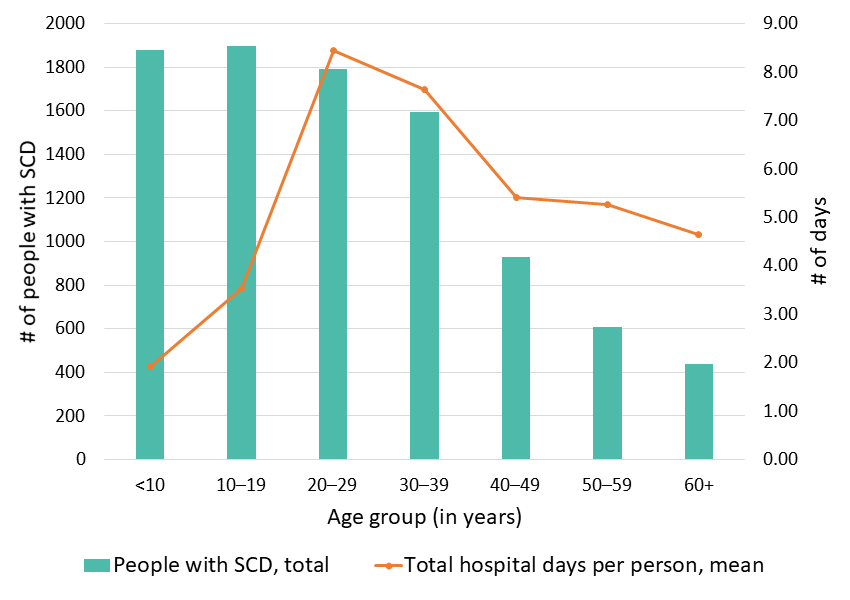
Figure 5: The average number of days in the hospital for people with SCD living in Georgia in 2018 was highest for 20- to 29-year-olds (8.4 days) and lowest for <10-year-olds (1.9 days).
| Age group (in years) | Patients, total | Total hospital days per patient, mean |
|---|---|---|
| <10 | 1,879 | 1.91 |
| 10–19 | 1,895 | 3.53 |
| 20–29 | 1,792 | 8.44 |
| 30–39 | 1,596 | 7.63 |
| 40–49 | 930 | 5.41 |
| 50–59 | 610 | 5.25 |
| 60+ | 439 | 4.64 |
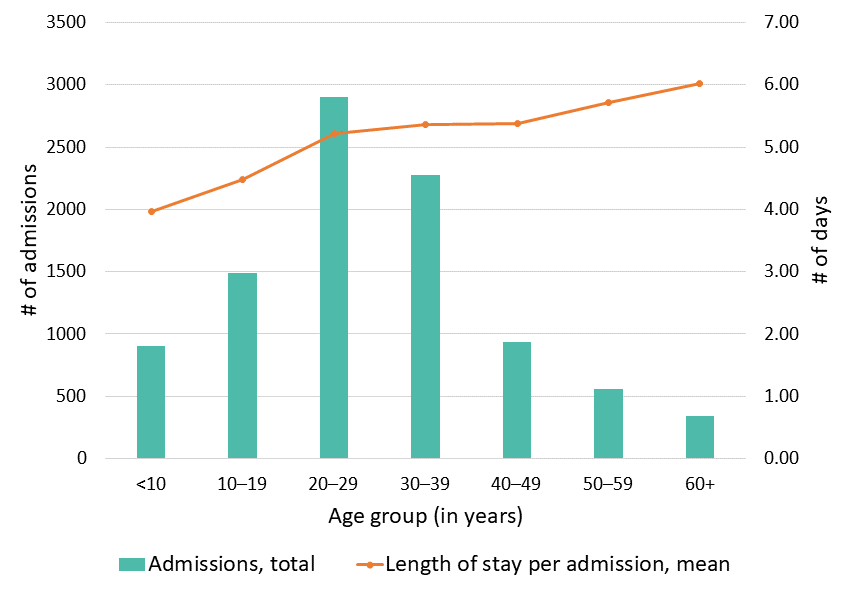
Figure 6: The average length of stay for a hospitalization for people with SCD living in Georgia in 2018 was highest for people aged 60 years and older (6.0 days) and lowest for <10-year-olds (4.0 days).
| Age group (in years) | People with SCD, total | Length of stay per admission, mean |
|---|---|---|
| <10 | 1,879 | 3.97 |
| 10–19 | 1,895 | 4.49 |
| 20–29 | 1,792 | 5.22 |
| 30–39 | 1,596 | 5.35 |
| 40–49 | 930 | 5.39 |
| 50–59 | 610 | 5.71 |
| 60+ | 439 | 6.02 |
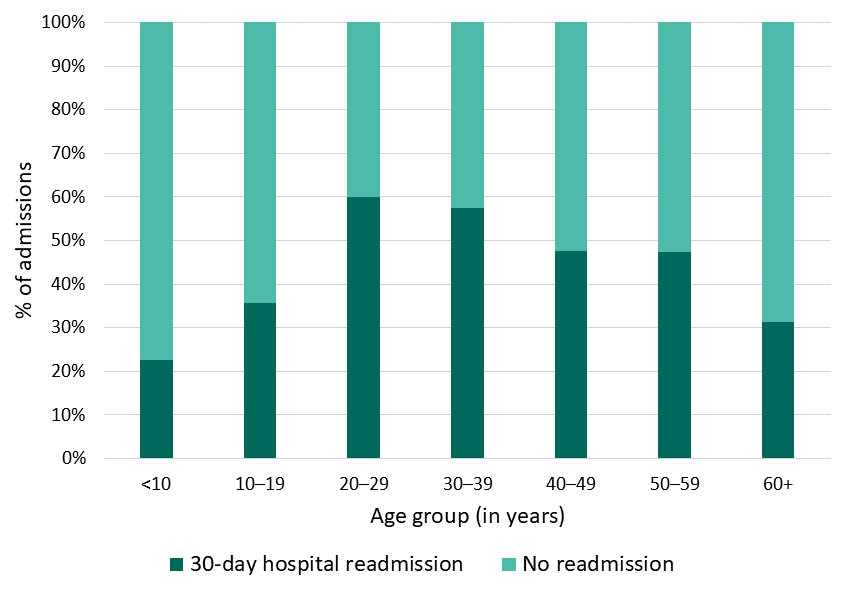
Figure 7: More than 55% of hospitalizations for 20- to 39-year-olds with SCD living in Georgia in 2018 were followed by another hospital or ED admission within 30 days of discharge from the first hospitalization.
| Age group (in years) | 30-day hospital readmission | No readmission |
|---|---|---|
| <10 | 23% | 77% |
| 10–19 | 36% | 64% |
| 20–29 | 60% | 40% |
| 30–39 | 57% | 43% |
| 40–49 | 48% | 52% |
| 50–59 | 47% | 53% |
| 60+ | 31% | 69% |
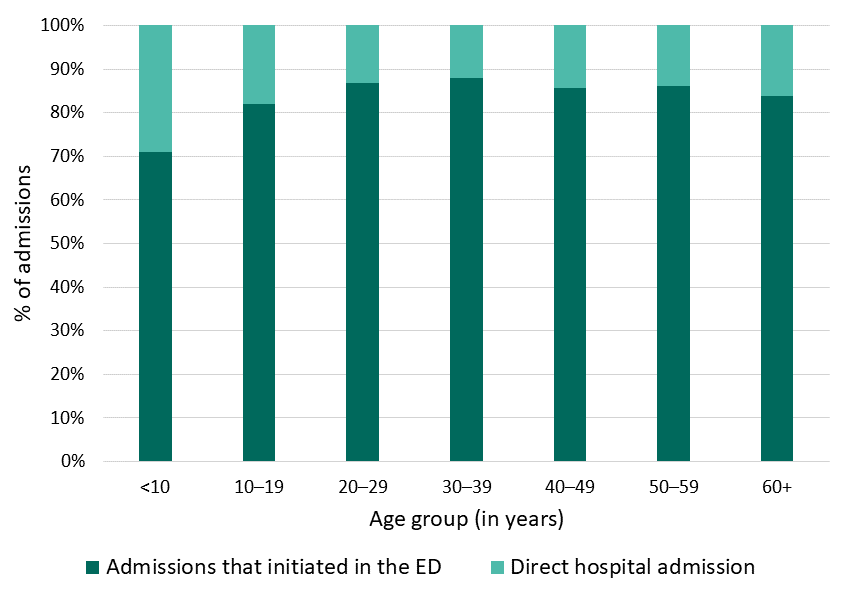
Figure 8: More than 80% of hospitalizations for people aged 10 years and older with SCD living in Georgia in 2018 began in the ED.
| Age group (in years) | Admissions that initiated in the ED | Direct hospital admission |
|---|---|---|
| <10 | 71% | 29% |
| 10–19 | 82% | 18% |
| 20–29 | 87% | 13% |
| 30–39 | 88% | 12% |
| 40–49 | 86% | 14% |
| 50–59 | 86% | 14% |
| 60+ | 84% | 16% |
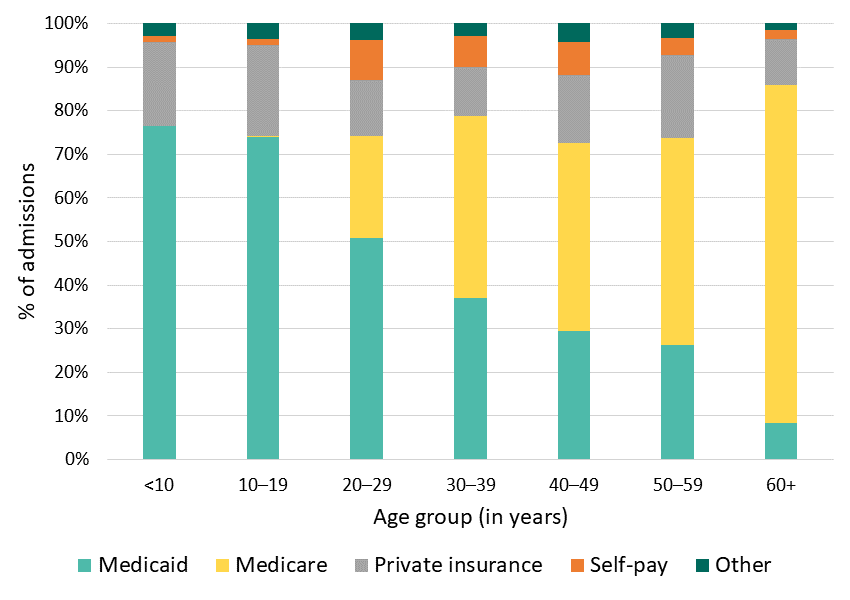
Figure 9: More than 70% of hospitalizations for people with SCD living in Georgia in 2018 were paid for by public insurance (Medicaid or Medicare).
| Age group (in years) | Payer of hospital admission: Medicaid | Payer of hospital admission: Medicare | Payer of hospital admission: Private Insurance | Payer of hospital admission: Self-Pay | Payer of hospital admission: Other |
| <10 | 76% | 0% | 19% | 1% | 3% |
| 10–19 | 74% | 0% | 21% | 2% | 3% |
| 20–29 | 51% | 23% | 13% | 9% | 4% |
| 30–39 | 37% | 42% | 11% | 7% | 3% |
| 40–49 | 29% | 43% | 16% | 8% | 4% |
| 50–59 | 26% | 47% | 19% | 4% | 3% |
| 60+ | 8% | 78% | 11% | 2% | 1% |
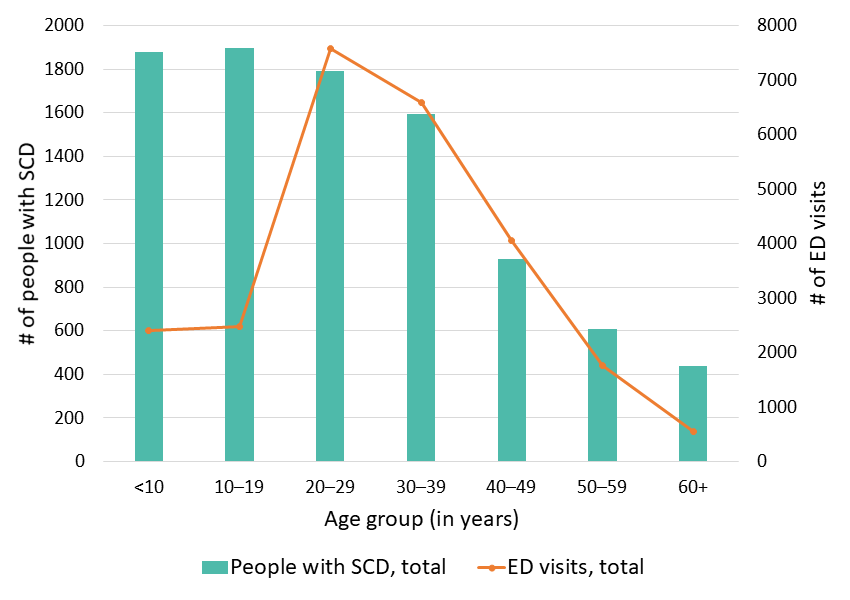
Figure 10: People with SCD living in Georgia in 2018 had a total of more than 25,000 ED visits.
| Age group (in years) | People with SCD, total | ED visits, total |
|---|---|---|
| <10 | 1879 | 2400 |
| 10–19 | 1895 | 2485 |
| 20–29 | 1792 | 7579 |
| 30–39 | 1596 | 6592 |
| 40–49 | 930 | 4055 |
| 50–59 | 610 | 1766 |
| 60+ | 439 | 555 |
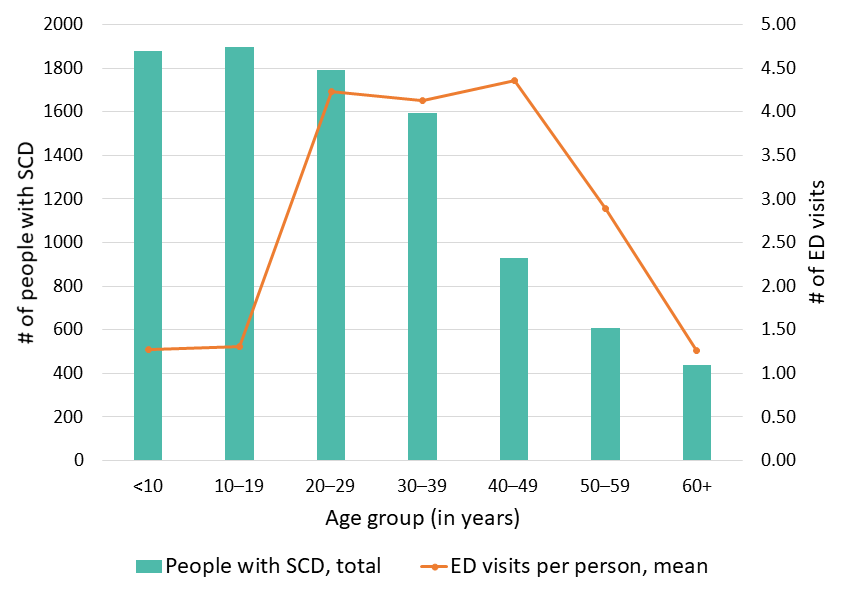
Figure 11: The average number of ED visits for people with SCD living in California in 2018 was highest for 40- to 49-year-olds (4.4 ED visits) and lowest for <10-year-olds and people aged 60 years and older (1.3 ED visits).
| Age group (in years) | People with SCD, total | ED visits per patient, mean |
|---|---|---|
| <10 | 1879 | 1.28 |
| 10–19 | 1895 | 1.31 |
| 20–29 | 1792 | 4.23 |
| 30–39 | 1596 | 4.13 |
| 40–49 | 930 | 4.36 |
| 50–59 | 610 | 2.90 |
| 60+ | 439 | 1.26 |
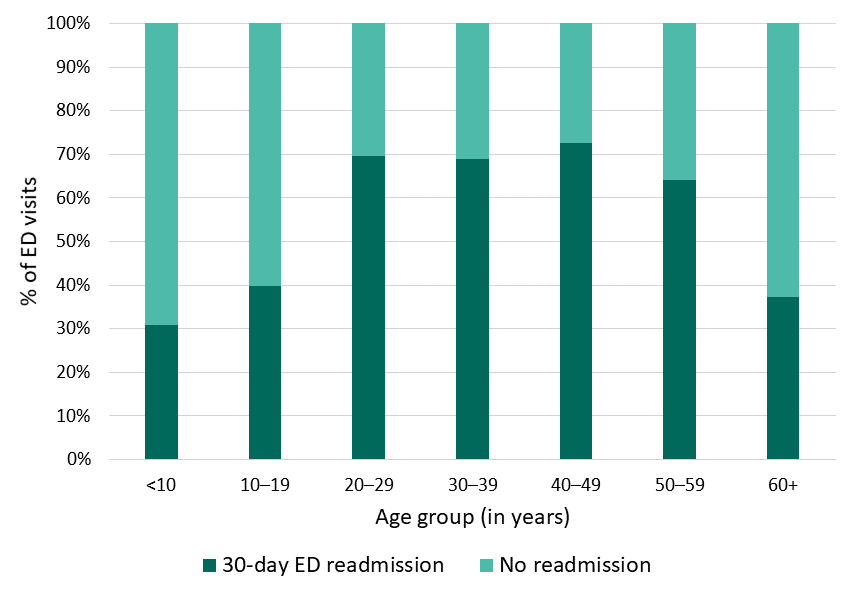
Figure 12: Almost 70% of ED visits for 20- to 59-year-olds with SCD living in Georgia in 2018 were followed by another hospital or ED admission within 30 days of discharge from the first ED visit.
| Age group (in years) | 30-day ED readmission | No readmission |
|---|---|---|
| <10 | 31% | 69% |
| 10–19 | 40% | 60% |
| 20–29 | 70% | 30% |
| 30–39 | 69% | 31% |
| 40–49 | 73% | 27% |
| 50–59 | 64% | 36% |
| 60+ | 37% | 63% |
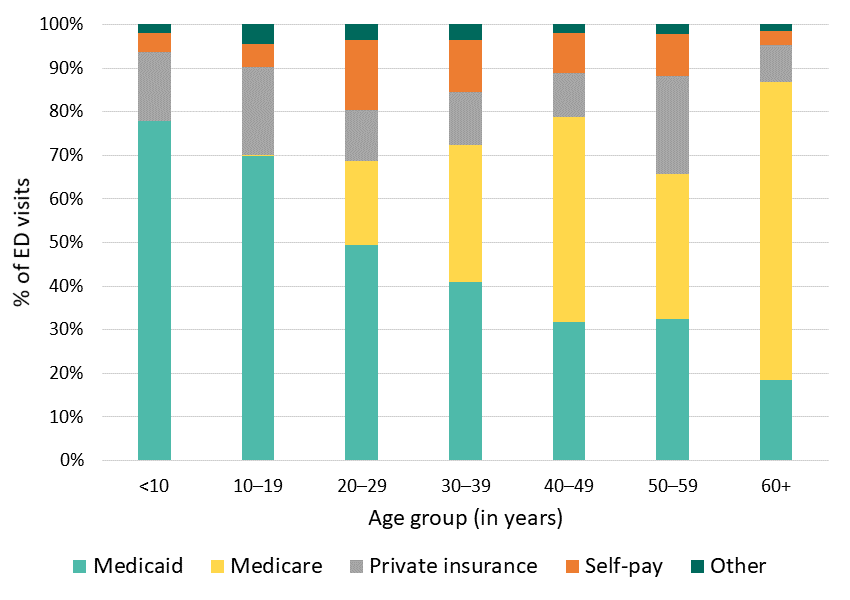
Figure 13: More than 70% of ED visits for people with SCD living in Georgia in 2018 were paid for by public insurance (Medicaid or Medicare).
| Age group (in years) | Payer of ED visit: Medicaid | Payer of ED visit: Medicare | Payer of ED visit: Private Insurance | Payer of ED visit: Self-Pay | Payer of ED visit: Other |
|---|---|---|---|---|---|
| <10 | 78% | 0% | 16% | 4% | 2% |
| 10–19 | 70% | 0% | 20% | 5% | 5% |
| 20–29 | 49% | 19% | 12% | 16% | 3% |
| 30–39 | 41% | 31% | 12% | 12% | 4% |
| 40–49 | 32% | 47% | 10% | 9% | 2% |
| 50–59 | 33% | 33% | 22% | 10% | 2% |
| 60+ | 19% | 68% | 8% | 3% | 1% |
