2015 Demographics: Diagnostic Testing
‹View Table of Contents
December 2017
Source: 2015 CDC Hearing Screening and Follow-up Survey (HSFS)*
*Each jurisdiction’s submitted data underwent a cleaning and error check process. Jurisdictions reporting ≥20% of total infants receiving diagnostic testing in the “unknown” category, for each demographic variable, were excluded from this analysis.
ǂPercentage of infants receiving diagnostic testing for each category is calculated among the total number of infants not passing hearing screening (i.e. % Males Receiving Diagnostic Testing After Not Passing Hearing Screening = (( # Total with No Hearing Loss:Male + Total with Permanent Hearing Loss:Male) / # Total Not Pass Screening:Male ) * 100 ). Test for significant difference between percentages was calculated using Pearson’s chi-square test where α = 0.05 (Software: SAS 9.4, Cary, NC).
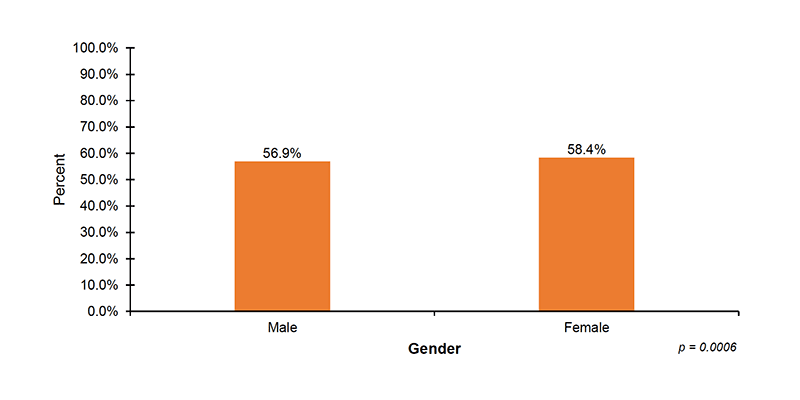
Data reported by 51 out of 56 jurisdictions that responded to the HSFS in 2015: includes AL, AK, AS, AZ, AR, CA, Commonwealth of the Northern Mariana Islands, CT, DE, District of Columbia, GA, Guam, HI, ID, IN, IA, KS, KY, LA, ME, Marshall Islands, MD, MA, MI, Micronesia, MS, MO, MT, NE, NV, NH, NJ, NM, NY, NC, ND, OH, OK, OR, Palau, RI, SC, SD, TN, TX, UT, VA, VT, WA, WI, WY.
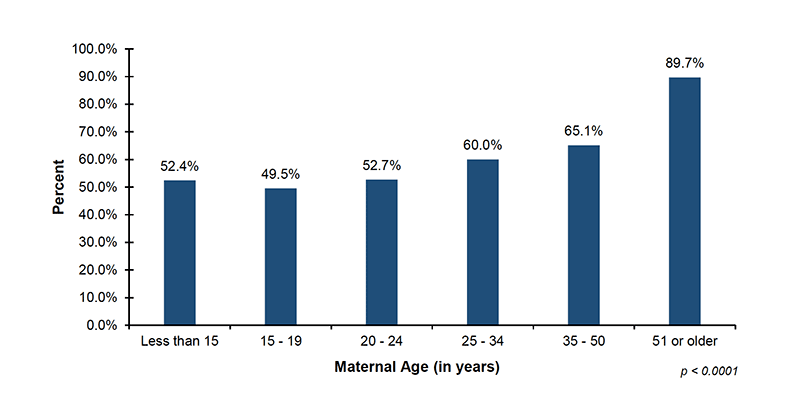
Data reported by 38 out of 56 jurisdictions that responded to the HSFS in 2015: includes AL, AK, AZ, AR, Commonwealth of the Northern Mariana Islands, CT, DE, GA, HI, IA, KS, KY, LA, Marshall Islands, MA, MI, MS, MO, MT, NE, NV, NH, NJ, NY, NC, OH, OK, OR, Palau, RI, SC, SD, TN, UT, VT, VA, WI, WY.
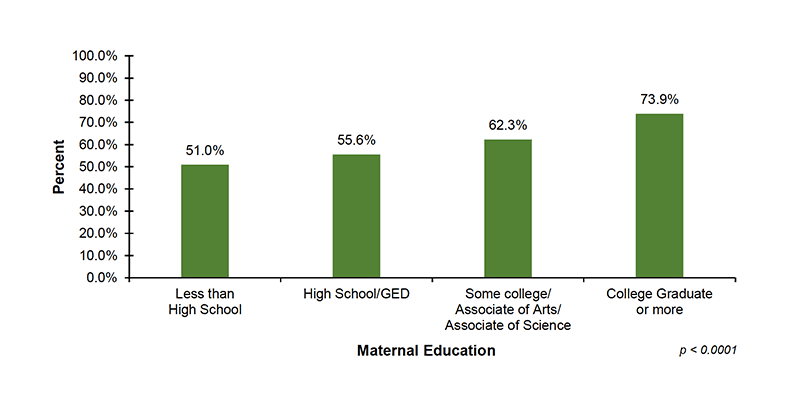
Data reported by 27 out of 56 jurisdictions that responded to the HSFS in 2015: includes AL, AZ, AR, Commonwealth of the Northern Mariana Islands, CT, GA, HI, IA, KS, LA, MA, MI, MO, MT, NE, NV, NJ, NC, OH, OR, Palau, RI, SD, TN, VA, WI, WY.
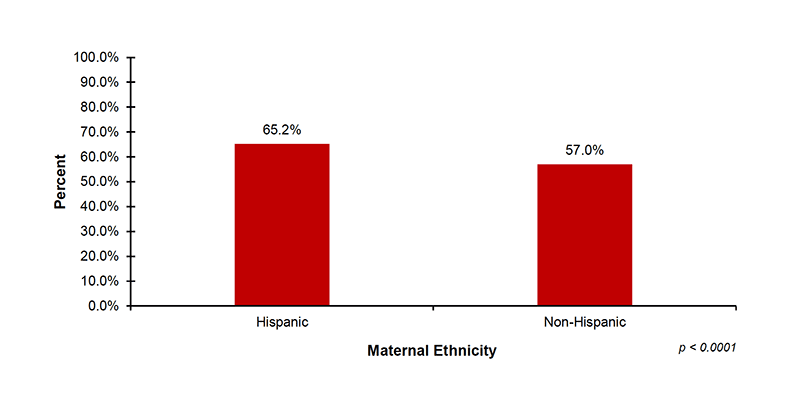
Data reported by 36 out of 56 jurisdictions that responded to the HSFS in 2015: includes AL, American Samoa, AZ, AR, Commonwealth of the Northern Mariana Islands, CT, DE, GA, Guam, HI, IA, KS, LA, MA, MI, Micronesia, MS, MO, MT, NE, NV, NH, NJ, NY, NC, OH, OR, Palau, RI, SC, SD, TN, VT, VA, WI, WY.
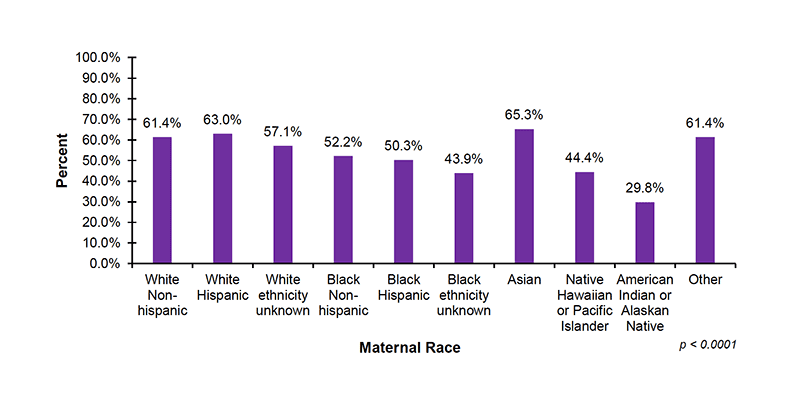
Data reported by 37 out of 56 jurisdictions that responded to the HSFS in 2015: includes AL, AZ, AR, Commonwealth of the Northern Mariana Islands, CT, DE, GA, Guam, HI, IA, KS, LA, ME, Marshall Islands, MA, MI, Micronesia, MS, MO, MT, NE, NV, NH, NJ, NY, NC, OH, OR, Palau, RI, SC, SD, TN, UT, VA, WI, WY.
Pages in this Report
- 2015 National CDC EHDI Summary
- 2015 Summary of Hearing Screening Among Total Occurent Births
- 2015 Summary of Detailed Hearing Screening Results
- 2015 Summary of Infants Screened Before 1 Month of Age
- 2015 Summary of Reasons for No Documented Hearing Screening Among Total Occurrent Births
- 2015 Summary of Diagnostics Among Infants Not Passing Hearing Screening
- 2015 Summary of Infants Not Passing Hearing Screening Diagnosed Before 3 Months of Age
- 2015 Summary of Reasons for No Documented Diagnosis Among Infants Not Passing Hearing Screening
- 2015 Summary of Early Intervention (EI) Among Infants Identified with Permanent Hearing Loss
- 2015 Summary of Infants Identified with Permanent Hearing Loss Enrolled in Early Intervention (EI) Before 6 Months of Age
- 2015 Summary of Reasons for No Documented Early Intervention (EI) Services Among Infants Identified with Permanent Hearing Loss
- 2015 Type and Severity Summary of Identified Cases of Hearing Loss (By Ear)
- 2015 Demographics: Newborn Hearing Screening
- ›2015 Demographics: Diagnostic Testing
- 2015 Demographics: Enrollment in Early Intervention (EI)