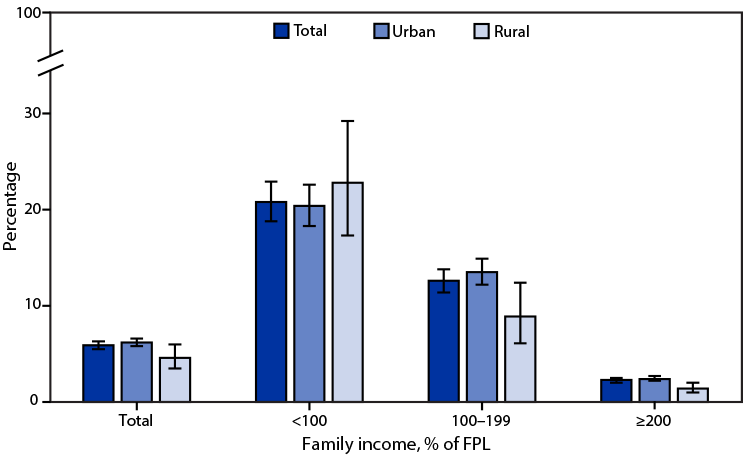
QuickStats: Percentage* of Adults Aged ≥18 Years Living in Families That Were Food-Insecure in the Past 30 Days,† by Family Income§ and Urbanicity¶ — National Health Interview Survey, United States, 2021**
Weekly / December 2, 2022 / 71(48);1539
Altmetric:

Abbreviations: FPL = federal poverty level; MSA = metropolitan statistical area.
* With 95% CIs indicated by error bars.
† Based on a composite recode of responses to 10 questions developed by the U.S. Department of Agriculture to measure whether adults had problems with eating patterns or access, quality, variety, and quantity of food in the past 30 days. In the National Health Interview Survey, food insecurity was calculated at the family level, and families that reported six or more problems were considered to be food-insecure.
§ Income was calculated as a percentage of FPL, which is based on family income and family size, using the U.S. Census Bureau’s poverty thresholds.
¶ Urban-rural status is determined by the Office of Management and Budget’s February 2013 delineation of MSAs, in which each MSA must have at least one urban area with ≥50,000 inhabitants. Areas with <50,000 inhabitants are grouped into the rural category.
** Estimates are based on household interviews of a sample of the civilian, noninstitutionalized U.S. population.
In 2021, 5.9% of adults aged ≥18 years lived in families that were food-insecure in the past 30 days. The percentage was higher in urban areas (6.2%) compared with rural areas (4.6%) overall and within households earning 100%–199% of FPL (13.5% versus 8.9%) and ≥200% of FPL (2.4% versus 1.4%). For adults living in families with incomes <100% of FPL, the percentage was similar in rural (22.8%) and urban (20.4%) areas. The percentage decreased with family income from 20.8% for those living in families earning <100% of FPL to 2.3% for those living in families earning ≥200% of FPL. The same pattern was found for adults living in urban and rural areas.
Source: National Center for Health Statistics, National Health Interview Survey, 2021. https://www.cdc.gov/nchs/nhis/index.htm
Reported by: Amanda E. Ng, MPH, qkd2@cdc.gov, 301-458-4587; John C. Lin.
For more information on this topic, CDC recommends the following link: https://www.cdc.gov/chronicdisease/programs-impact/sdoh.htm
Suggested citation for this article: QuickStats: Percentage of Adults Aged ≥18 Years Living in Families That Were Food-Insecure in the Past 30 Days, by Family Income and Urbanicity — National Health Interview Survey, United States, 2021. MMWR Morb Mortal Wkly Rep 2022;71:1539. DOI: http://dx.doi.org/10.15585/mmwr.mm7148a6.
MMWR and Morbidity and Mortality Weekly Report are service marks of the U.S. Department of Health and Human Services.
Use of trade names and commercial sources is for identification only and does not imply endorsement by the U.S. Department of
Health and Human Services.
References to non-CDC sites on the Internet are
provided as a service to MMWR readers and do not constitute or imply
endorsement of these organizations or their programs by CDC or the U.S.
Department of Health and Human Services. CDC is not responsible for the content
of pages found at these sites. URL addresses listed in MMWR were current as of
the date of publication.
All HTML versions of MMWR articles are generated from final proofs through an automated process. This conversion might result in character translation or format errors in the HTML version. Users are referred to the electronic PDF version (https://www.cdc.gov/mmwr) and/or the original MMWR paper copy for printable versions of official text, figures, and tables.
Questions or messages regarding errors in formatting should be addressed to mmwrq@cdc.gov.