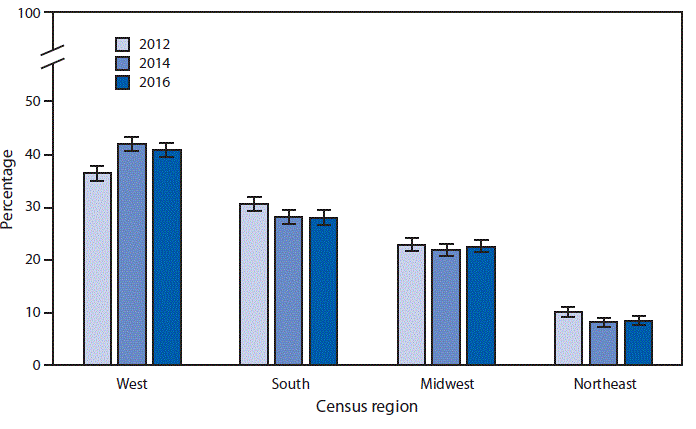
QuickStats: Percentage* of Residential Care Communities,† by U.S. Census Region§ — National Study of Long-Term Care Providers, 2012–2016
Weekly / November 2, 2018 / 67(43);1223

* With 95% confidence intervals indicated with error bars.
† Residential care communities include those that were state-regulated; had four or more beds; and provided room and board with at least two meals a day, around-the-clock on-site supervision, and help with personal care, such as bathing and dressing or health-related services such as medication management. Residential care communities licensed to exclusively serve the mentally ill or the intellectually or developmentally disabled populations were excluded.
§ Northeast: Connecticut, Maine, Massachusetts, New Hampshire, New Jersey, New York, Pennsylvania, Rhode Island, and Vermont. Midwest: Illinois, Indiana, Iowa, Kansas, Michigan, Minnesota, Missouri, Nebraska, North Dakota, Ohio, South Dakota, and Wisconsin. South: Alabama, Arkansas, Delaware, District of Columbia, Florida, Georgia, Kentucky, Louisiana, Maryland, Mississippi, North Carolina, Oklahoma, South Carolina, Tennessee, Texas, Virginia, and West Virginia. West: Alaska, Arizona, California, Colorado, Hawaii, Idaho, Montana, Nevada, New Mexico, Oregon, Utah, Washington, and Wyoming.
During 2012–2016, the percentage of residential care communities located in the West increased from 36.4% to 40.8%. Throughout the period, a higher percentage of residential care communities were located in the West compared with other regions. The percentage of residential care communities declined from 30.6% in 2012 to 28% in 2016 in the South and from 10.1% to 8.6% in the Northeast. In the Midwest, the percentage was 22.9% in 2012 and 22.6% in 2016.
Source: National Study of Long-Term Care Providers, 2012–2016 data. https://www.cdc.gov/nchs/nsltcp/index.htm.
Reported by: Amanuel Melekin, PhD, opn1@cdc.gov; Vincent Rome, MPH.
Suggested citation for this article: QuickStats: Percentage of Residential Care Communities, by U.S. Census Region — National Study of Long-Term Care Providers, 2012–2016. MMWR Morb Mortal Wkly Rep 2018;67:1223. DOI: http://dx.doi.org/10.15585/mmwr.mm6743a7.
MMWR and Morbidity and Mortality Weekly Report are service marks of the U.S. Department of Health and Human Services.
Use of trade names and commercial sources is for identification only and does not imply endorsement by the U.S. Department of
Health and Human Services.
References to non-CDC sites on the Internet are
provided as a service to MMWR readers and do not constitute or imply
endorsement of these organizations or their programs by CDC or the U.S.
Department of Health and Human Services. CDC is not responsible for the content
of pages found at these sites. URL addresses listed in MMWR were current as of
the date of publication.
All HTML versions of MMWR articles are generated from final proofs through an automated process. This conversion might result in character translation or format errors in the HTML version. Users are referred to the electronic PDF version (https://www.cdc.gov/mmwr) and/or the original MMWR paper copy for printable versions of official text, figures, and tables.
Questions or messages regarding errors in formatting should be addressed to mmwrq@cdc.gov.