Behavioral and Clinical Characteristics of Persons Receiving Medical Care for HIV Infection — Medical Monitoring Project, United States, 2009
Corresponding author: Heather Bradley, National Center for HIV/AIDS, Viral Hepatitis, STD, and TB Prevention, CDC. Telephone: 404-639-8373; E-mail: iyk5@cdc.gov.
Abstract
Problem: As of December 31, 2009, an estimated 864,748 persons were living with human immunodeficiency virus (HIV) infection in the 50 U.S. states, the District of Columbia, and six U.S.-dependent areas. Whereas HIV surveillance programs in the United States collect information about persons with a diagnosis of HIV infection, supplemental surveillance systems collect in-depth information about the behavioral and clinical characteristics of persons receiving outpatient medical care for HIV infection. These data are needed to reduce HIV-related morbidity and mortality and HIV transmission.
Reporting Period Covered: Data were collected during June 2009–May 2010 for patients receiving medical care at least once during January–April 2009.
Description of the System: The Medical Monitoring Project (MMP) is an ongoing surveillance system that assesses behaviors and clinical characteristics of HIV-infected persons who have received outpatient medical care. For the 2009 data collection cycle, participants must have been aged ≥18 years and have received medical care during January–April 2009 at sampled facilities that provide HIV medical care within participating MMP project areas. Behavioral and selected clinical data were collected using an in-person interview, and most clinical data were collected using medical record abstraction. A total of 23 project areas in 16 states and Puerto Rico were funded to collect data during the 2009 data collection cycle. The data were weighted for probability of selection and nonresponse to be representative of adults receiving outpatient medical care for HIV infection in the United States and Puerto Rico. Prevalence estimates are presented as weighted percentages. The period of reference is the 12 months before the patient interview unless otherwise noted.
Results: The patients in MMP represent 421,186 adults who received outpatient medical care for HIV infection in the United States and Puerto Rico during January–April 2009. Of adults who received medical care for HIV infection, an estimated 71.2% were male, 27.2% were female, and 1.6% were transgender. An estimated 41.4% were black or African American, 34.6% were white, and 19.1% were Hispanic or Latino. The largest proportion (23.1%) were aged 45–49 years. Most patients (81.1%) had medical coverage; 40.3% had Medicaid, 30.6% had private health insurance, and 25.7% had Medicare.
An estimated 69.6% of patients had three or more documented CD4+ T-lymphocyte cell (CD4+) or HIV viral load tests. Most patients (88.7%) were prescribed antiretroviral therapy (ART), and 71.6% had a documented viral load that was undetectable or ≤200 copies/mL at their most recent test. Among sexually active patients, 55.0% had documentation in the medical record of being tested for syphilis, 23.2% for gonorrhea, and 23.9% for chlamydia.
Noninjection drugs were used for nonmedical purposes by an estimated 27.1% of patients, whereas injection drugs were used for nonmedical purposes by 2.1% of patients. Overall, 12.9% of patients engaged in unprotected sex with a partner of negative or unknown HIV status.
Unmet supportive service needs were prevalent, with an estimated 22.8% in need of dental care and 12.0% in need of public benefits, including Social Security Income or Social Security Disability Insurance. Fewer than half of patients (44.8%) reported receiving HIV and sexually transmitted disease prevention counseling from a health-care provider.
Interpretation: The findings in this report indicate that most adults living with HIV who received medical care in 2009 were taking ART, had CD4+ and HIV viral load testing at regular intervals, and had health insurance or other coverage. However, some patients did not receive clinical services and treatment in accordance with guidelines. Some patients engaged in behaviors, such as unprotected sex, that increase the risk for transmitting HIV to sex partners, and some used noninjection or injection drugs or both.
Public Health Actions: Local and state health departments and federal agencies can use MMP data for program planning to determine allocation of services and resources, guide prevention planning, assess unmet medical and supportive service needs, inform health-care providers, and help focus intervention programs and health policies at the local, state, and national levels.
Introduction
As of December 31, 2009, an estimated 864,748 persons were living with a diagnosis of human immunodeficiency virus (HIV) infection in the 50 U.S. states, the District of Columbia, and six U.S. dependent areas (1). The estimated number of new HIV diagnoses was 48,283 in 2009 (1). Although the National HIV Surveillance System in the United States collects information about persons with a diagnosis of HIV infection (2), supplemental surveillance systems provide detailed information about care seeking, health-care use, use of supportive services, and other behaviors (3). In 2005, in response to an Institute of Medicine report outlining the need for representative data on persons living with HIV (4), CDC implemented the Medical Monitoring Project (MMP). MMP data from the 2005 and 2007 data collection cycles also have been published (5,6).
Methods
Sample and Areas
MMP is a cross-sectional, nationally representative, population-based surveillance system that assesses clinical and behavioral characteristics among adults with HIV infection receiving outpatient medical care in the United States and Puerto Rico. The MMP sample was selected in three consecutive stages: 1) U.S. states and territories, 2) outpatient facilities providing HIV care, and 3) HIV-infected adults aged ≥18 years who had at least one medical care visit to participating facilities during January–April 2009. A total of 23 areas were funded to collect data for the 2009 cycle (Figure): California (including the separately funded jurisdictions of Los Angeles County and San Francisco), Delaware, Florida, Georgia, Illinois (including Chicago), Indiana, Michigan, Mississippi, New Jersey, New York (including New York City), North Carolina, Oregon, Pennsylvania (including Philadelphia), Puerto Rico, Texas (including Houston), Virginia, and Washington. This report provides unweighted sample sizes and weighted prevalence estimates with 95% confidence intervals (CIs) for selected characteristics. Methods for MMP are described in more detail in this report (Appendix) and have been published previously (3,6,7). Additional information on MMP is available at http://www.cdc.gov/hiv/statistics/systems/mmp/index.html.
Data Collection
Interview
A trained interviewer conducted a computer-assisted personal interview. Two versions of the questionnaire (in English and Spanish) were used in 2009: a standard questionnaire and a short questionnaire. The short questionnaire was administered when a patient was too ill to complete the longer standard interview or when translation to a language other than Spanish was required. Only standard questionnaire data are included in this report.
Persons who agreed to participate were interviewed in a private location (e.g., at home or in a clinic). The standard interview contained 10 modules and took approximately 45 minutes to complete. Participants were reimbursed approximately $40 in a cash equivalent for participation. Reimbursement amounts differed slightly by project area. Modules included questions on demographics, access to and use of health care, met and unmet needs for supportive services, sexual behavior, depression, gynecologic and reproductive history (women only), drug and alcohol use, and use of HIV prevention services.
Medical Record Abstraction
Patients' medical records were abstracted after the patients were interviewed. Medical records were abstracted by MMP staff using an electronic application provided by CDC. Abstracted information included diagnoses of conditions that, when they occur in HIV-infected persons, meet the definition for acquired immunodeficiency syndrome (AIDS); prescription of antiretroviral medications; laboratory results; and health-care use in the 12 months before the interview.
Minimum Data Set
The minimum data set is an adjunct to MMP that includes an extract of National HIV Surveillance System data for sampled patients in MMP. Information for the minimum data set is obtained locally, primarily from the Enhanced HIV/AIDS Reporting System (eHARS) (8), but might include data from other local sources such as participating facilities. The minimum data set provides descriptive information about sampled patients for statistical weighting, including nonresponse adjustment.
Data Weighting
Data used to generate national estimates were weighted for the probability of selection based on known probabilities of selection at each sampling stage. In addition, data were weighted to adjust for nonresponse using predictors of patient-level response, including facility size, race/ethnicity, time since HIV diagnosis, and age group.
Data Management and Statistical Analyses
Data were encrypted and transmitted to CDC through a secure data portal. Statistical software was used for analysis of weighted data to produce prevalence estimates (weighted percentages) and associated CIs (9). Data are not reported for any variables with fewer than five responses or a coefficient of variation of ≥30%. No statistical tests were performed.
The term patients in this report refers to adults living with HIV infection receiving outpatient medical care in the United States and Puerto Rico. The time period referenced is the 12 months before the patient interview unless otherwise noted. Measures used in this report are described in detail (Appendix).
Results
Facility and Patient Response Rates
Of 603 sampled eligible facilities within 23 project areas, 461 participated in MMP; the facility response rate, adjusted for eligibility, was 76%. In total, 9,338 patients were sampled from 461 participating facilities. Of these, 4,217 patients completed interviews using the standard questionnaire and had medical record abstractions, for an adjusted patient response rate of 51% (Table 1). The combined response rate for patients with both an interview and a medical record abstraction was 39% (Combined response rate = Project area response rate × Facility response rate × Adjusted patient response rate).
Sociodemographic Characteristics
The 4,217 respondents represent an estimated 421,186 adults living with HIV who received outpatient medical care in the United States and Puerto Rico during January–April 2009. These 421,186 adults are referred to hereafter as patients. An estimated 71.2% of patients were male, 27.2% were female, and 1.6% were transgender (Table 2). An estimated 50.3% identified themselves as heterosexual or straight; 41.4% as homosexual, gay or lesbian; and 8.3% as bisexual. An estimated 41.4% were black or African American, 34.6% were white, and 19.1% were Hispanic or Latino. Three fourths (75.5%) were aged ≥40 years, and 53.8% had received their HIV diagnosis ≥10 years previously. Half (50.6%) had more than a high school education, and 82.7% were born in the United States. Approximately 9.0% were homeless. An estimated 81.1% had any health coverage, 40.3% had Medicaid, 30.6% had private health insurance, and 25.7% had Medicare. Almost half (43.8%) had household incomes at or below federal poverty guidelines.
Clinical Characteristics
Using the CDC stage of disease classification for HIV (10), an estimated 67.6% of patients had stage 3 disease (Table 3); however, 12.4% of patients had a mean CD4+ T-lymphocyte (CD4+) count of 0–199 cells/µL in the past 12 months (Table 4). The estimated geometric mean CD4+ count was 505 cells/µL, and the median CD4+ count was 460 cells/µL (range: 4–2,388).
Use of Health-Care Services
An estimated 99.7% (CI: 99.5–99.9) of patients had one place in particular, such as a physician's office or clinic, where they received most of their HIV medical care. Patients traveled an estimated average of 34.2 minutes (range:1–480 minutes) to their usual HIV care provider.
An estimated 69.6% of patients had at least three CD4+ or HIV viral load tests documented in the medical record (Table 5). As recommended by guidelines, most patients had at least one viral load test in each 6-month interval (76.5%) and at least one CD4+ test annually (96.8%). Overall, an estimated 88.7% of patients had an ART prescription documented in the medical record, and 71.6% of all patients had an undetectable (≤200 copies/mL) viral load at last measurement.
Among the estimated 17.5% (CI: 16.0–19.1) of patients meeting the clinical criteria for Pneumocystis carinii pneumonia (PCP) prophylaxis, 78.8% (CI: 75.1–82.5) had a prescription for PCP prophylaxis documented in the medical record. Among the estimated 4.8% of patients meeting the clinical criteria for Mycobacterium avium complex (MAC) prophylaxis, 72.3% (CI: 65.7–79.0) had a prescription for MAC prophylaxis documented in the medical record. An estimated 78.5% (CI: 76.0–81.0) of patients received an influenza vaccination. Among sexually active patients, an estimated 23.2% were tested for gonorrhea, 23.9% for chlamydia, 55.0% for syphilis, and 19.7% for all three sexually transmitted diseases (STDs) (Table 6).
An estimated 5.2% of patients were seen in an emergency department or an urgent care center one time, and 1.4% were seen at least five times (Table 7). An estimated 4.5% of patients were admitted to a hospital one time, and 0.4% were admitted at least five times (Table 8).
Self-Reported Antiretroviral Medication Use and Adherence
An estimated 88.2% (CI: 86.8–89.6) of patients were currently taking ART. Among the estimated 6.6% (CI: 5.5–7.7) of patients with no history of ART use, 80% (CI: 74.9–85.1) had never taken ART because a physician advised a delay in treatment, whereas 11.2% (CI: 7.7–14.8) believed medications were unnecessary because they felt healthy or believed their HIV laboratory test results (e.g., CD4+ count and HIV viral load) were good (11.2%, CI: 7.7–14.8).
Among patients currently taking ART, an estimated 63.4% (CI: 61.2–65.7) were never troubled by ART side effects during the past 30 days, whereas 19.0% (CI: 16.9–21.2) were rarely troubled. Patients' ART medications were most commonly paid for by the AIDS Drug Assistance Program (40.1%, CI: 37.4–42.9), Medicaid (33.9%, CI: 29.4–38.4), private health insurance (25.4%, CI: 20.0–30.8), or Medicare (18.3%, CI: 16.2–20.3).
Estimated adherence to dose, schedule, and instructions for taking ART during the past 3 days among patients currently taking ART was 85.6% (CI: 84.1–87.1), 71.7% (CI: 69.3–74.1), and 69.0% (CI: 66.6–71.4), respectively. An estimated 92.8% of patients currently taking ART were very or extremely sure that they could take all of their medication as directed, and 87.4% believed their medication would have a positive effect on their health (Table 9). Among the estimated 61.9% (CI: 58.9–65.0) of patients who were currently taking ART and ever missed a dose, 28.6% missed their last dose because they forgot to take it, and 25.4% missed their last dose because of a change in daily routine (Table 10).
Depression and Substance Use
The estimated prevalence of major depression or other depression using the eight-item Patient Health Questionnaire (PHQ-8) algorithm based on Diagnostic and Statistical Manual of Mental Disorders, Fourth Edition (DSM-IV) criteria (11) was 25.6% (CI: 23.8–27.4), including12.4% (CI: 11.2–13.7) with major depression. Using the score-based method (12), an estimated 23.7% (CI: 21.9–25.5) of patients had current moderate or severe depression (a PHQ-8 severity score of ≥10).
An estimated 42.4% (CI: 39.7–45.1) of patients were current smokers, with 35.1% (CI: 32.8–37.3) smoking daily, 3.9% (CI: 2.9–4.8) weekly, 1.2% (CI: 0.8–1.5) monthly, and 2.3% (CI: 1.8–2.8) less than monthly. The estimated prevalence of current alcohol use was 66.4% (CI: 63.7–68.7), with 6.9% (CI: 5.6–8.1) using daily, 18.4% (CI: 17.0–19.7) weekly, 13.6% (CI: 12.2 –15.0) monthly, and 27.5% (CI: 25.7–29.3) less than monthly. An estimated 50.7% (CI: 48.6–52.8) of patients drank alcohol during the past 30 days. Among patients who drank alcohol during the past 30 days, the estimated typical average daily consumption was 3.1 drinks. An estimated 17.8% (CI: 16.4–19.3) of male patients and 12.6% (CI: 10.2–14.9) of female patients engaged in binge drinking during the past 30 days. Among patients who drank alcohol in the past 30 days, the estimated mean number of binge drinking days was 1.8 for male patients and 1.5 for female patients.
An estimated 27.1% (CI: 25.2–28.9) of patients used noninjection drugs for nonmedical purposes. An estimated 22.2% of patients used marijuana, whereas 5.5% used cocaine, 4.8% used crack, and 4.2% used amyl nitrite (Table 11). An estimated 24.0% (CI: 22.1–25.9) of patients drank alcohol before or during sex, whereas 11.9% (CI: 10.3–13.4) used noninjection drugs before or during sex.
An estimated 2.1% (CI: 1.2–2.9) of patients used injection drugs for nonmedical purposes. An estimated 1.1% (CI: 0.4–1.7) used crystal methamphetamine, 0.6% (CI: 0.2–1.0) used heroin, and 0.6% (CI: 0.2–0.9) used cocaine. Of the patients who used injection drugs, an estimated 67.7% (CI: 54.2–81.2) used injection drugs before or during sex.
Gynecologic and Reproductive Health
An estimated 20.9% (CI: 16.4–25.3) of female patients received HIV care at an obstetrics and gynecology clinic, and 77.4% (CI: 73.1–81.8) received a Papanicolaou (Pap) test. An estimated 24.7% (CI: 21.7–27.6) of female patients had been pregnant at least once since testing positive for HIV infection; of these, 80.7% (CI: 75.4–86.0) gave birth to one or more children after learning about their HIV status.
Sexual Behavior
An estimated 47.1% (CI: 42.3–52.0) of patients were men who have sex with men (MSM); 23.8% (CI: 21.2–26.4) were men who exclusively have sex with women (MSW); 26.7% (CI: 23.6–29.8) were women who have sex with men (WSM); 0.7% (CI: 0.4–1.1) were women who exclusively have sex with women (WSW); and 1.6% (CI: 1.1–2.1) were transgender. (Details on classification are provided [Appendix].) An estimated 61.8% (CI: 59.5–64.2) of patients were sexually active, 24.7% (CI: 21.8–27.7) engaged in unprotected sex, and 12.9% (CI: 11.4–14.4) engaged in unprotected sex with a partner with negative or unknown HIV status.
Among MSM, an estimated 69.7% (CI: 66.9–72.5) engaged in anal intercourse or oral sex with at least one man, 31.8% had any unprotected anal intercourse, and 13.7% had unprotected anal intercourse with a partner with negative or unknown HIV status (Table 12). The estimated mean number of sex partners among sexually active MSM during the past 12 months was 5.0 (range: 1–250).
Among MSW, an estimated 57.6% (CI: 53.1–62.0) engaged in oral sex, vaginal intercourse, or anal intercourse with at least one woman; 14.5% had any unprotected vaginal intercourse; and 9.0% had unprotected vaginal intercourse with a partner with negative or unknown HIV status (Table 13). The estimated mean number of female sex partners among sexually active MSW during the past 12 months was 1.5 (range: 1–20).
Among WSM, an estimated 54.7% (CI: 51.8–57.5) engaged in anal intercourse, oral sex, or vaginal intercourse with at least one man, 22.8% had any unprotected vaginal intercourse, and 14.6% had unprotected vaginal intercourse with a partner with negative or unknown HIV status (Table 14). The estimated mean number of male sex partners among sexually active WSM was 1.2 (range: 1–6).
Among WSW, an estimated 65.0% (CI: 44.5–85.4) engaged in sexual activity with at least one woman. The estimated mean number of sex partners among sexually active WSW was 1.2 (range: 1–2). Data on sexual behavior among WSW is not collected by MMP. Among transgender persons, an estimated 49.8% (CI: 35.9–63.7) engaged in any vaginal or anal intercourse with at least one partner. Given the small sample size, the estimate for the mean number of sex partners among transgender persons is not reported here.
Met and Unmet Need for Support Services
An estimated 57.7% of patients received HIV case management services, 57.4% received dental care, 42.0% received counseling about how to prevent the spread of HIV, and 41.9% received medicine through the AIDS Drug Assistance Program (Table 15). An estimated 22.8% of patients had unmet needs for dental care, 12.0% for public benefits such as Social Security Income or Social Security Disability Insurance, 8.6% for transportation services, 8.2% for shelter or housing services, and 7.0% for meal or food services.
Prevention Activities
An estimated 44.8% (CI: 39.8–49.8) of patients received counseling from a physician, a nurse, or another health-care worker about HIV and STD prevention; 30.4% (CI: 26.2–34.5) had a one-on-one conversation with an outreach worker, a counselor, or a prevention program worker about prevention, and 16.2% (CI: 13.2–19.1) participated in an organized session involving a small group of persons (excluding discussions with friends) to discuss prevention of HIV and other STDs. An estimated 54.8% (CI: 51.7–57.9) of patients received free condoms from various organizations; of these, 55.2% (CI: 49.3–61.1) received free condoms from a physician's office or other health clinic, 32.7% (CI: 28.2–37.2) from an HIV/AIDS-focused community-based organizations, 13.6% (CI: 10.9–16.3) from a social venue (i.e., bar, club, bathhouse, gym, or bookstore), 7.0% (CI: 3.7–10.3) from an STD clinic, 4.0% (CI: 2.6–5.4) from a special event, 1.3% (CI: 0.4–2.2) from a family planning clinic, and 1.3% (CI: 0.6–1.9) from an injecting drug use outreach organization (excluding needle exchange programs).
Discussion
Sociodemographic Characteristics
The findings in this report are nationally representative of HIV-infected adults receiving outpatient medical care in the United States and Puerto Rico. Understanding the sociodemographic characteristics of HIV-infected persons who are receiving medical care can be used to develop strategies to improve HIV medical care and to encourage retention in care. Compared with the general U.S. population, HIV-infected persons in medical care are more likely to be male (13), black or African American (14), and, among men, to identify themselves as homosexual or gay (15). In addition, they are less likely to have access to resources that promote health (16). For example, approximately 40% had incomes below the poverty level, and 9% were homeless, whereas only 14% of persons in the general U.S. population had incomes below the poverty level (17), and 0.2% were homeless (18). In addition, some patients did not have health insurance or coverage, which might present extra challenges for accessing and maintaining care (19–21). The data from this report highlight that to improve HIV treatment and prevention in the United States, programs and policies need to be aware of the multiple unique needs of persons living with HIV infection.
Clinical Characteristics
Stage of disease among persons living with HIV infection has been associated with morbidity and mortality (22). Although nearly 68% of patients had received a diagnosis of stage 3 HIV infection, approximately 87% had a mean CD4+ count of ≥200 cells/µL in the past 12 months, suggesting most patients have had CD4+ recovery (23). Stage of disease and current CD4+ count are important indicators of access to and use of medical care.
Use of Health-Care Services
Access to health-care services and treatment is necessary to improve health outcomes among persons living with HIV. By design, MMP samples patients with a usual source of care, and nearly all patients had a source of usual HIV medical care. Treatment guidelines recommend that health-care providers conduct CD4+ and HIV viral load testing every 3–6 months, and for clinically stable patients with suppressed HIV viral load, health-care providers should monitor CD4+ count every 6–12 months (24). These data suggest most patients received CD4+ and HIV viral load testing at regular intervals. In addition, guidelines recommend that ART be considered for all HIV-infected persons (24). Nearly 89% of patients were prescribed ART, and almost 72% had viral suppression at the time of their most recent viral load test. Increasing the number of patients who are prescribed ART and achieve viral suppression is central to reducing HIV morbidity, mortality, and transmission.
Although PCP and MAC infections are AIDS-defining conditions that are preventable with the appropriate use of prophylactic medications, approximately 20% of eligible patients were not receiving guideline-recommended prophylaxis (25). Clinicians should be encouraged to adhere to guidelines for the prevention of opportunistic infections through continuing medical education and targeted campaigns to disseminate updated guidelines (25).
Persons living with HIV have increased risk for developing serious influenza-related complications (26,27), and public health recommendations for HIV-infected persons include yearly influenza vaccination (25). Approximately 78% of patients received the influenza vaccination, which is higher than other reported estimates among HIV-infected persons (28–30) and might be due to possible limitations in accurate recall during self-report, rather than relying on data from medical record abstraction. Clinicians are encouraged to provide annual influenza vaccinations to their HIV-infected patients (31).
The occurrence of STDs among HIV-infected persons indicates ongoing or recurrent high-risk behavior (32). Because many STDs are asymptomatic (32) and can increase HIV transmission risk (33), guidelines for incorporating HIV prevention into the medical care of persons living with HIV recommend that all sexually active, HIV-infected persons be screened at least annually for syphilis, gonorrhea, and chlamydia (34). These findings suggest fewer than 20% of patients were tested for STDs annually. Health-care providers should be reminded of the need to test sexually active HIV-infected patients for STDs annually (34).
Relatively low percentages of MMP patients were hospitalized or used emergency departments or urgent care clinics. This might partially be explained by the expected benefit associated with the receipt of routine medical care, such as viral load and CD4+ monitoring, in settings that follow existing recommendations. Other publications have described higher rates of emergency department visits among HIV-infected persons than in the general population, suggesting a greater use of acute care resources (35). In addition, HIV-infected persons are likely to be hospitalized; a previous study reported that 19.7% of HIV-infected persons had at least one hospital admission annually (36). Clinicians should continue to adhere to extant treatment guidelines (24,25,34,37) to reduce preventable emergency department visits and hospitalizations.
Self-Reported Antiretroviral Medication Use and Adherence
Use of ART has resulted in a major reduction of HIV-related morbidity and mortality (24). In MMP, more than 88% of patients were currently taking ART. The most common reason for not currently taking ART was a physician advising the patient to delay treatment. This finding is likely a result of earlier recommendations to delay the use of ART until a threshold nadir CD4+ count was documented. The 2012 recommendation (24) that ART should be initiated for all HIV-infected persons, regardless of CD4+ count, would not be reflected among these patients receiving HIV care in 2009.
Adherence to ART is necessary for HIV viral suppression, improved health and immune function (24), and prevention of HIV transmission (38). Although dose adherence was relatively high among patients, schedule and instruction adherence were not. Providers can help patients identify barriers and reasons for lack of adherence. Strategies to improve adherence include prescribing less complex regimens (e.g., fewer pills, fewer doses, or both) and using a multidisciplinary team approach to care (e.g., nurses, social workers, pharmacists, and medication managers) (24). Other strategies include the use of pill boxes and medication alarms to remind patients to take medication (39). Adherence should be assessed at clinic visits as part of routine care (24), either through self-report (40,41) or other measures such as pill counts (42). In addition, CDC has identified several medication adherence interventions aimed at improving adherence behaviors and viral suppression (43).
Depression and Substance Use
Among HIV-infected persons, depression can affect quality of life and might lead to treatment nonadherence (44–46), which is associated with increased morbidity, mortality, and HIV transmission risk. Depression also has been associated with substance abuse (44,47,48), which can lead to risky behaviors that might further facilitate HIV transmission. More than 12% of patients experienced major depression, and approximately one fourth experienced some type of depression. Behavioral Risk Factor Surveillance System data from 2006 and 2008 indicate that 4.1% of adults in the general population had current major depression and 9.1% had any current depression (49,50). Medical providers should continue to screen for depression regularly, providing treatment when indicated (37).
Cigarette smoking is the leading cause of preventable death in the United States (51), accounting for approximately 440,000 deaths in the United States each year (52). Approximately 42% of HIV-infected persons smoke cigarettes, compared with an estimated 19% of adults in the U.S. general population (53). HIV-infected persons who smoke are susceptible to respiratory complications (54), including lower respiratory tract infections (55–57), chronic obstructive pulmonary disease, an increased risk for lung cancer (58–61), and death (62). As part of a comprehensive approach to health-care delivery for persons with HIV, providers should assess all patients for tobacco use and promote smoking cessation among current smokers during routine patient encounters (63).
Injection drug use can result in direct transmission of HIV infection. In addition, the use of alcohol (64,65), noninjection drugs (64,66), and injection drugs (67) are associated with risky sexual behaviors and might complicate the management of HIV infection (68–71). Approximately one fourth of patients used noninjection drugs, and 2% used injection drugs. The medical care setting provides an opportunity to assess drug use behavior, communicate prevention messages, positively reinforce changes to safer behavior, and provide referrals for services such as substance abuse treatment (34).
Gynecologic and Reproductive Health
Women living with HIV are at an increased risk for developing cervical cancer (72–74). HIV-infected women should be screened for cervical cancer twice within the first year after initial HIV diagnosis, and if the results are normal, annually thereafter (25,75). The findings in this report are consistent with previous studies showing that 77%–81% of HIV-infected women received cervical cancer screening in the past year (76,77) and suggest that one of five women with HIV were not screened for cervical cancer. Additional efforts should be undertaken to increase the number of health-care providers who provide cervical cancer screening for HIV-infected women (25,75).
Forty-nine percent of all pregnancies in the United States are unintended (78). In general, pregnancy rates among HIV-infected women are lower than that of the general population (79). Data from MMP show that almost one fourth of women had been pregnant since testing positive for HIV, of whom nearly 81% gave birth to one or more children after learning their HIV status. Because many women living with HIV are aware of their HIV status before becoming pregnant, health-care providers who routinely care for HIV-infected women of reproductive age should integrate preconception care into standard medical care visits (80,81).
Sexual Behavior
An estimated 92% of all new HIV infections in the United States are attributed to sexual transmission (1). Previous studies have found that after diagnosis, most persons with HIV infection decrease sexual behaviors that increase the risk for transmission (82). However, some might continue to engage in sexual behaviors that can place others at risk for infection. Nearly 14% of MSM, 9% of MSW, and 15% of WSM engaged in unprotected sex with a partner of negative or unknown HIV status. All groups (MSM, MSW, and WSM) had higher proportions of unprotected sex with main partners than with casual partners. The prevalence of sexual risk behaviors highlights the continued need to incorporate HIV prevention into the medical care of HIV-infected persons (34). The clinical setting offers an opportunity for providers to talk with patients about ways to prevent HIV transmission.
Met and Unmet Need for Supportive Services
Receipt of supportive services has been linked to improved retention in care (83,84), quality of life (85), and ART adherence (86). Unmet need for dental care was particularly high, as has been reported previously (87). These data underscore the continued need for supportive services for persons with HIV infection and can be used to help determine how resources should be allocated.
HIV Prevention Activities
HIV prevention counseling by health-care providers can help to reduce risk behaviors among HIV-infected patients (88–90). Fewer than half of patients were counseled by a health-care provider about HIV and STD prevention. These findings indicate important missed opportunities to engage patients in HIV risk reduction discussions and to refer patients for additional preventive services such as STD screening and partner notification.
Male latex condoms, when used correctly and consistently, are effective in preventing HIV and other STDs (91–93). Over half of patients received free condoms. Previous MMP findings have shown that use of and intention to use condoms are high among HIV-infected patients receiving free condoms (6). Condom distribution programs are an important part of HIV prevention programs in the United States.
Limitations
The findings in this report are subject to at least five limitations. First, because the survey was administered during face-to-face interviews, some responses might have been subject to social response bias, which might have resulted in underreporting of socially undesirable behaviors such as drug use and overreporting of socially desirable behaviors such as adherence to antiretroviral therapy. Second, the combined response rate of 39% is lower than optimal. However, data were adjusted for nonresponse. Third, a potential bias toward favorable outcomes might exist because patients in MMP have a usual source of HIV care and are receiving medical care. Fourth, in certain instances, stratification by certain characteristics produced numbers that were too small for reliable interpretation and were not presented. Finally, although data collection for the 2009 cycle was completed in May 2010, the dissemination of these data was delayed because they were the first to be weighted for national representativeness, and establishing and standardizing the weighting procedures and calculated variables took additional time.
Conclusion
Through ongoing data collection, MMP provides nationally representative estimates of behavioral and clinical characteristics among adults receiving medical care for HIV infection. In addition, MMP monitors risk behaviors, supportive service needs, use of health-care and HIV prevention services, and adherence to clinical care guidelines. These data can be used by local, state, territorial, and federal policymakers to develop strategies for HIV care, treatment, and prevention.
Acknowledgments
This report is based, in part, on contributions by MMP participants, facilities, community and provider advisory boards, and interviewers and abstractors. The MMP principal investigators and project coordinators include Karen Mark, MD, Tyler Arguello, PhD, Robert Flores, III, California Department of Public Health, Sacramento, California; Nanette Benbow, MAS, Alexandra Gagner, MPH, Chicago Department of Public Health, Chicago, Illinois; Robert Vella, MPH, James Dowling, MPH, Delaware Health and Social Services, Dover, Delaware; Rebecca Grigg, PhD, Pam Fillmore, Florida Department of Health, Tallahassee, Florida; Jianglan White, MD, Sarah Loch, MPH, Jennifer Taussig, MPH, Georgia Department of Public Health, Atlanta, Georgia; Salma Khuwaja, MD, DrPH, Adebowale Awosika-Olumo, MD, Osaro Mgbere PhD, Houston Department of Health and Human Services, Houston, Texas; Cheryl Ward, MS, Marti Merritt, Illinois Department of Public Health, Chicago, Illinois; Daniel Hillman, MPH, Jodi Rhynearson, MPA, Indiana State Department of Health, Indianapolis, Indiana; Amy Rock Wohl, PhD, Judy Tejero, MPH, Los Angeles County Department of Public Health, Los Angeles, California; Eve D. Mokotoff, MPH, Meosia Lee-Turner; Michigan Department of Community Health, Detroit, Michigan; Leandro Mena, MD, Arti Barnes, MD, Joseph Grice, MPH, Mississippi State Department of Health, Jackson, Mississippi; Barbara Bolden, PhD, Kidane Meshesha, MPH, New Jersey Department of Health and Senior Services, Trenton, New Jersey; Bridget J. Anderson, PhD, Lou Smith, MD, Michael D. Miele, New York State Department of Health, Albany, New York; Alan Neaigus, PhD, Julie Lulek, MPH, New York City Department of Health and Mental Hygiene, New York City, New York; Delbert Williams, PhD, Ryan Collins, MPH, North Carolina Department of Health, Raleigh, North Carolina; Sean Schafer, MD, Kari Greene, MPH, Oregon Public Health Division, Portland, Oregon; Leequan Ray, PhD, Pennsylvania Department of Health, Harrisburg, Pennsylvania; Kathleen A. Brady, MD, Michael G. Eberhart, MPH, Philadelphia Department of Public Health, Philadelphia, Pennsylvania; Sandra Miranda De León, MPH, Gladys Girona Lozada, MSc, Puerto Rico Department of Health, San Juan, Puerto Rico; Susan Scheer, PhD, Maree Kay Parisi, San Francisco Department of Public Health, San Francisco, California; Sharon K. Melville, MD, Sylvia Odem, MPH, Texas Department of State Health Services, Austin, Texas; Dena Bensen, MPH, Celestine Buyu, MPH, Carmen Roman, Virginia Department of Health, Richmond, Virginia; Maria Courogen, MPH, Washington State Department of Health; Elizabeth Barash, MPH, and Susan Buskin, PhD, Public Health Seattle & King County, Seattle, Washington; the Data Coordinating Center for HIV Supplemental Surveillance at ICF International; and members of the MMP team, Division of HIV/AIDS Prevention, National Center for HIV/AIDS, Viral Hepatitis, STD, and TB Prevention, CDC, Atlanta, Georgia.
References
- CDC. HIV surveillance report, 2011; Atlanta, GA: CDC; 2013. Available at http://www.cdc.gov/hiv/topics/surveillance/resources/reports.
- Nakashima AK, Fleming PL. HIV/AIDS surveillance in the United States, 1981–2001. J Acquir Immune Defic Syndr 2003;32(Suppl 1):S68–85.
- McNaghten AD, Wolfe MI, Onorato I, et al. Improving the representativeness of behavioral and clinical surveillance for persons with HIV in the United States: the rationale for developing a population-based approach. PLoS ONE 2007;2:e550.
- Institute of Medicine. Measuring what matters: allocation, planning and quality assessment for the Ryan White CARE Act. Washington, DC: Institute of Medicine; 2004.
- CDC. Clinical and behavioral characteristics of persons receiving medical care for HIV infection: Medical Monitoring Project, 2005 pilot data collection cycle. Atlanta, GA: CDC; 2010. Available at http://www.cdc.gov/hiv/topics/surveillance/resources/reports.
- CDC. Clinical and behavioral characteristics of adults receiving medical care for HIV infection—Medical Monitoring Project, United States, 2007. MMWR 2011;(No. SS-11).
- Frankel MR, McNaghten A, Shapiro MF, et al. A probability sample for monitoring the HIV-infected population in care in the U.S. and in selected states. Open AIDS J 2012;6:67–76.
- CDC. HIV/AIDS Statistics Center. Atlanta, GA: CDC; 2013. Available at http://www.cdc.gov/hiv/statistics.
- SAS Institute Inc. SAS version 9.3. Cary, NC: SAS Institute Inc; 2011.
- CDC. Revised surveillance case definitions for HIV infection among adults, adolescents, and children aged <18 months and for HIV infection and AIDS among children aged 18 months to <13 years—United States, 2008. MMWR 2008;57(No. RR-10).
- American Psychiatric Association. American Psychiatric Association Task Force on DSM-IV. Diagnostic and statistical manual of mental disorders: DSM-IV-TR. 4th ed. Washington, DC: American Psychiatric Association; 2000.
- Kroenke K, Strine TW, Spitzer RL, et al. The PHQ-8 as a measure of current depression in the general population. J Affect Disord 2009;114:163–73.
- Howden LM, Meyer JA. Age and sex composition: 2010. Washington, DC: US Census Bureau; 2011. Available at http://www.census.gov/prod/cen2010/briefs/c2010br-03.pdf.
- Humes KR, Jones NA, Ramirez RR. Overview of race and Hispanic origin: 2010. Washington, DC: US Census Bureau; 2011. Available at http://www.census.gov/prod/cen2010/briefs/c2010br-02.pdf.
- Chandra A, Mosher WD, Copen C, Sionean C. Sexual behavior, sexual attraction, and sexual identity in the United States: data from the 2006–2008 National Survey of Family Growth. Hyattsville, MD: CDC; 2011.
- Pellowski JA, Kalichman SC, Matthews KA, Adler N. A pandemic of the poor: social disadvantage and the U.S. HIV epidemic. Am Psychol 2013;68:197–209.
- DeNavas-Walt CPB, Smith JC; U.S. Census Bureau. Income, poverty, and health insurance coverage in the United States: 2009. Washington, DC: US Government Printing Office; 2010. Available at http://www.census.gov/prod/2010pubs/p60-238.pdf.
- US Department of Housing and Urban Development. The 2009 annual homeless assessment report to Congress. Washington, DC: US Department of Housing and Urban Development; 2010. Available at http://www.huduser.org/publications/pdf/5thHomelessAssessmentReport.pdf.
- Bozzette SA, Berry SH, Duan N, et al. The care of HIV-infected adults in the United States. HIV Cost and Services Utilization Study Consortium. N Engl J Med 1998;339:1897–904.
- Brown VB, Smereck GA, German V, et al. Change in perceived barriers and facilitators to treatment among women with HIV/AIDS as a function of psychosocial service utilization. AIDS Patient Care STDS 2000;14:381–90.
- Shapiro MF, Morton SC, McCaffrey DF, et al. Variations in the care of HIV-infected adults in the United States: results from the HIV Cost and Services Utilization Study. JAMA 1999;281:2305–15.
- Antiretroviral Therapy Cohort Collaboration. Life expectancy of individuals on combination antiretroviral therapy in high-income countries: a collaborative analysis of 14 cohort studies. Lancet 2008;372:293–9.
- Hirsch HH, Kaufmann G, Sendi P, Battegay M. Immune reconstitution in HIV-infected patients. Clin Infect Dis 2004;38:1159–66.
- Panel on Antiretroviral Guidelines for Adults and Adolescents. Guidelines for the use of antiretroviral agents in HIV-1-infected adults and adolescents. Washington, DC: Department of Health and Human Services. Available at http://aidsinfo.nih.gov/ContentFiles/AdultandAdolescentGL.pdf.
- CDC. Guidelines for prevention and treatment of opportunistic infections in HIV-infected adults and adolescents: recommendations from CDC, the National Institutes of Health, and the HIV Medicine Association of the Infectious Diseases Society of America. MMWR 2009;58(No. RR-4).
- CDC. HIV/AIDS and the flu: questions and answers. Atlanta, GA: CDC; 2013. Available at http://www.cdc.gov/flu/protect/hiv-flu.htm.
- Cohen C, Moyes J, Tempia S, et al. Severe Influenza-associated Respiratory Infection in High HIV Prevalence Setting, South Africa, 2009–2011. Emerg Infect Dis 2013;19:1766–74.
- Althoff KN, Anastos K, Nelson KE, et al. Predictors of reported influenza vaccination in HIV-infected women in the United States, 2006–2007 and 2007–2008 seasons. Prev Med 2010;50:223–9.
- Gallagher KM, Juhasz M, Harris NS, et al. Predictors of influenza vaccination in HIV-infected patients in the United States, 1990–2002. J Infect Dis 2007;196:339–46.
- Durham MD, Buchacz K, Armon C, et al. Rates and correlates of influenza vaccination among HIV-infected adults in the HIV Outpatient Study (HOPS), USA, 1999–2008. Prev Med 2011;53:89–94.
- CDC. Prevention and control of seasonal influenza with vaccines. Recommendations of the Advisory Committee on Immunization Practices—United States, 2013–2014. MMWR 2013;62(No. RR-07).
- CDC. Sexually transmitted diseases treatment guidelines, 2010. MMWR 2010;59(No. RR-12).
- Fleming DT, Wasserheit JN. From epidemiological synergy to public health policy and practice: the contribution of other sexually transmitted diseases to sexual transmission of HIV infection. Sex Transm Infect 1999;75:3–17.
- CDC. Health Resources Services Administration, National Institutes of Health, HIV Medicine Association of the Infectious Diseases Society of America. Incorporating HIV prevention into the medical care of persons living with HIV. Recommendations of CDC, the Health Resources and Services Administration, the National Institutes of Health, and the HIV Medicine Association of the Infectious Diseases Society of America. MMWR 2003;52(No. RR-12).
- Mohareb A, Rothman R, Hsieh YH. Emergency department (ED) utilization by HIV-infected ED patients in the United States in 2009 and 2010—a national estimation. HIV Med 2013;14:605–13.
- Fleishman JA, Gebo KA, Reilly ED, et al. Hospital and outpatient health services utilization among HIV-infected adults in care 2000–2002. Med Care 2005;43(Suppl):40–52.
- Aberg JA, Kaplan JE, Libman H, et al. Primary care guidelines for the management of persons infected with human immunodeficiency virus: 2009 update by the HIV medicine Association of the Infectious Diseases Society of America. Clin Infect Dis 2009;49:651–81.
- Cohen MS, Chen YQ, McCauley M, et al. Prevention of HIV-1 infection with early antiretroviral therapy. N Engl J Med 2011;365:493–505.
- Mannheimer SB, Morse E, Matts JP, et al. Sustained benefit from a long-term antiretroviral adherence intervention. Results of a large randomized clinical trial. J Acquir Immune Defic Syndr 2006;43(Suppl 1):S41–7.
- Lu M, Safren SA, Skolnik PR, et al. Optimal recall period and response task for self-reported HIV medication adherence. AIDS Behav 2008;12:86–94.
- Simoni JM, Kurth AE, Pearson CR, et al. Self-report measures of antiretroviral therapy adherence: a review with recommendations for HIV research and clinical management. AIDS Behav 2006;10:227–45.
- Kalichman SC, Amaral CM, Cherry C, et al. Monitoring medication adherence by unannounced pill counts conducted by telephone: reliability and criterion-related validity. HIV Clin Trials 2008;9:298–308.
- CDC. Good-evidence medication adherence interventions. Atlanta, GA: CDC. Available at http://www.cdc.gov/hiv/topics/research/prs/ma-good-evidence-interventions.htm.
- Chander G, Himelhoch S, Moore RD. Substance abuse and psychiatric disorders in HIV-positive patients: epidemiology and impact on antiretroviral therapy. Drugs 2006;66:769–89.
- Horberg MA, Silverberg MJ, Hurley LB, et al. Effects of depression and selective serotonin reuptake inhibitor use on adherence to highly active antiretroviral therapy and on clinical outcomes in HIV-infected patients. J Acquir Immune Defic Syndr 2008;47:384–90.
- Yun LW, Maravi M, Kobayashi JS, Barton PL, Davidson AJ. Antidepressant treatment improves adherence to antiretroviral therapy among depressed HIV-infected patients. J Acquir Immune Defic Syndr 2005;38:432–8.
- Davis L, Uezato A, Newell JM, Frazier E. Major depression and comorbid substance use disorders. Curr Opin Psychiatry 2008;21:14–8.
- Sadock BJ, Sadock VA, Ruiz P, Kaplan HI. Kaplan & Sadock's comprehensive textbook of psychiatry. 9th ed. Philadelphia, PA: Wolters Kluwer Health/Lippincott Williams & Wilkins; 2009.
- CDC. Current depression among adults—United States, 2006 and 2008. MMWR 2010;59:1229–35.
- CDC. Erratum. Current depression among adults—United States, 2006 and 2008. MMWR 2011;60:518.
- CDC. Annual smoking-attributable mortality, years of potential life lost, and economic costs—United States, 1995–1999. MMWR 2002;51:300–3.
- US Department of Health and Human Services. The health consequences of smoking: a report of the Surgeon General. Atlanta, GA; 2004. Available at http://www.surgeongeneral.gov/library.
- CDC. Current cigarette smoking among adults—United States, 2011. MMWR 2012;61:889–94.
- Rahmanian S, Wewers ME, Koletar S, et al. Cigarette smoking in the HIV-infected population. Proc Am Thorac Soc 2011;8:313–9.
- Benard A, Mercie P, Alioum A, et al. Bacterial pneumonia among HIV-infected patients: decreased risk after tobacco smoking cessation. ANRS CO3 Aquitaine Cohort, 2000–2007. PLoS ONE 2010;5:e8896.
- Gordin FM, Roediger MP, Girard PM, et al. Pneumonia in HIV-infected persons: increased risk with cigarette smoking and treatment interruption. Am J Respir Crit Care Med 2008;178:630–6.
- Kohli R, Lo Y, Homel P, et al. Bacterial pneumonia, HIV therapy, and disease progression among HIV-infected women in the HIV epidemiologic research (HER) study. Clin Infect Dis 2006;43:90–8.
- Cadranel J, Garfield D, Lavole A, et al. Lung cancer in HIV infected patients: facts, questions and challenges. Thorax 2006;61:1000–8.
- Engels EA, Biggar RJ, Hall HI, et al. Cancer risk in people infected with human immunodeficiency virus in the United States. Int J Cancer 2008;123:187–94.
- Guiguet M, Boue F, Cadranel J, et al. Effect of immunodeficiency, HIV viral load, and antiretroviral therapy on the risk of individual malignancies (FHDH-ANRS CO4): a prospective cohort study. Lancet Oncol 2009;10:1152–9.
- Patel P, Hanson DL, Sullivan PS, et al. Incidence of types of cancer among HIV-infected persons compared with the general population in the United States, 1992–2003. Ann Intern Med 2008;148:728–36.
- Helleberg M, Afzal S, Kronborg G, et al. Mortality attributable to smoking among HIV-1-infected individuals: a nationwide, population-based cohort study. Clin Infect Dis 2013;56:727–34.
- Fiore MCJC, Baker TB. Treating tobacco use and dependence: 2008 update. Rockville, MD: US Department of Health and Human Services; 2008. Available at http://www.ahrq.gov/professionals/clinicians-providers/guidelines-recommendations/tobacco/clinicians/treating_tobacco_use08.pdf.
- Purcell DW, Parsons JT, Halkitis PN, Mizuno Y, Woods WJ. Substance use and sexual transmission risk behavior of HIV-positive men who have sex with men. J Subst Abuse 2001;13:185–200.
- Stein M, Herman DS, Trisvan E, et al. Alcohol use and sexual risk behavior among human immunodeficiency virus-positive persons. Alcohol Clin Exp Res 2005;29:837–43.
- Campsmith ML, Nakashima AK, Jones JL. Association between crack cocaine use and high-risk sexual behaviors after HIV diagnosis. J Acquir Immune Defic Syndr 2000;25:192–8.
- Rondinelli AJ, Ouellet LJ, Strathdee SA, et al. Young adult injection drug users in the United States continue to practice HIV risk behaviors. Drug Alcohol Depend 2009;104:167–74.
- Bruce RD, Altice FL. Clinical care of the HIV-infected drug user. Infect Dis Clin North Am 2007;21:149–79.
- Celentano DD, Lucas G. Optimizing treatment outcomes in HIV-infected patients with substance abuse issues. Clin Infect Dis 2007;45(Suppl 4):S318–23.
- Hendershot CS, Stoner SA, Pantalone DW, Simoni JM. Alcohol use and antiretroviral adherence: review and meta-analysis. J Acquir Immune Defic Syndr 2009;52:180–202.
- Nijhawan A, Kim S, Rich JD. Management of HIV infection in patients with substance use problems. Curr Infect Dis Rep 2008;10:432–8.
- Hawes SE, Critchlow CW, Faye Niang MA, et al. Increased risk of high-grade cervical squamous intraepithelial lesions and invasive cervical cancer among African women with human immunodeficiency virus type 1 and 2 infections. J Infect Dis 2003;188:555–63.
- Schiffman MH, Bauer HM, Hoover RN, et al. Epidemiologic evidence showing that human papillomavirus infection causes most cervical intraepithelial neoplasia. J Natl Cancer Inst 1993;85:958–64.
- Schuman P, Ohmit SE, Klein RS, et al. Longitudinal study of cervical squamous intraepithelial lesions in human immunodeficiency virus (HIV)-seropositive and at-risk HIV-seronegative women. J Infect Dis 2003;188:128–36.
- ACOG Committee on Practice Bulletins—Gynecology. ACOG Practice Bulletin No. 109: Cervical cytology screening. Obstet Gynecol 2009;114:1409–20.
- Oster AM, Sullivan PS, Blair JM. Prevalence of cervical cancer screening of HIV-infected women in the United States. J Acquir Immune Defic Syndr 2009;51:430–6.
- Stein MD, Cunningham WE, Nakazono T, et al. Screening for cervical cancer in HIV-infected women receiving care in the United States. J Acquir Immune Defic Syndr 2001;27:463–6.
- Finer LB, Zolna MR. Unintended pregnancy in the United States: incidence and disparities, 2006. Contraception 2011;84:478–85.
- Massad LS, Springer G, Jacobson L, et al. Pregnancy rates and predictors of conception, miscarriage and abortion in US women with HIV. AIDS 2004;18:281–6.
- US Department of Health and Human Services; Panel on Treatment of HIV-Infected Pregnant Women and Prevention of Perinatal Transmission. Recommendations for use of antiretroviral drugs in pregnant HIV-1-infected women for maternal health and interventions to reduce perinatal HIV transmission in the United States. Rockville, MD: US Department of Health and Human Services; 2013. Available at http://aidsinfo.nih.gov/contentfiles/lvguidelines/PerinatalGL.pdf.
- CD C. Recommendations to improve preconception health and health care—United States. A report of the CDC/ATSDR Preconception Care Work Group and the Select Panel on Preconception Care. MMWR 2006;55(No. RR-6).
- Marks G, Crepaz N, Senterfitt JW, Janssen RS. Meta-analysis of high-risk sexual behavior in persons aware and unaware they are infected with HIV in the United States: implications for HIV prevention programs. J Acquir Immune Defic Syndr 2005;39:446–53.
- Ashman JJ, Conviser R, Pounds MB. Associations between HIV-positive individuals' receipt of ancillary services and medical care receipt and retention. AIDS Care 2002;14(Suppl 1):S109–18.
- Sherer R, Stieglitz K, Narra J, et al. HIV multidisciplinary teams work: support services improve access to and retention in HIV primary care. AIDS Care 2002;14(Suppl 1):S31–44.
- Chin JJ, Botsko M, Behar E, Finkelstein R. More than ancillary: HIV social services, intermediate outcomes and quality of life. AIDS Care 2009;21:1289–97.
- Reif S, Whetten K, Lowe K, Ostermann J. Association of unmet needs for support services with medication use and adherence among HIV-infected individuals in the southeastern United States. AIDS Care 2006;18:277–83.
- Heslin KC, Cunningham WE, Marcus M, et al. A comparison of unmet needs for dental and medical care among persons with HIV infection receiving care in the United States. J Public Health Dent 2001;61:14–21.
- Fisher JD, Fisher WA, Cornman DH, et al. Clinician-delivered intervention during routine clinical care reduces unprotected sexual behavior among HIV-infected patients. J Acquir Immune Defic Syndr 2006;41:44–52.
- Richardson JL, Milam J, McCutchan A, et al. Effect of brief safer-sex counseling by medical providers to HIV-1 seropositive patients: a multi-clinic assessment. AIDS 2004;18:1179–86.
- Rose CD, Courtenay-Quirk C, Knight K, et al. HIV intervention for providers study: a randomized controlled trial of a clinician-delivered HIV risk-reduction intervention for HIV-positive people. J Acquir Immune Defic Syndr 2010;55:572–81.
- CDC. Update: barrier protection against HIV infection and other sexually transmitted diseases. MMWR 1993;42:589–91, 97.
- Varghese B, Maher JE, Peterman TA, Branson BM, Steketee RW. Reducing the risk of sexual HIV transmission: quantifying the per-act risk for HIV on the basis of choice of partner, sex act, and condom use. Sex Transm Dis 2002;29:38–43.
- Weller S, Davis K. Condom effectiveness in reducing heterosexual HIV transmission. Cochrane Database Syst Rev 2002;(1):CD003255.
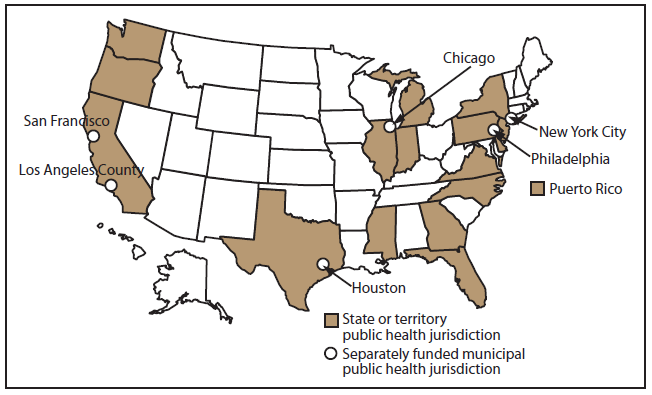
Alternate Text: This figure shows a map of the United States with the areas funded to collect data for the 2009 cycle. A total of 23 areas were funded: California (including the separately funded jurisdictions of Los Angeles County and San Francisco), Delaware, Florida, Georgia, Illinois (including Chicago), Indiana, Michigan, Mississippi, New Jersey, New York (including New York City), North Carolina, Oregon, Pennsylvania (including Philadelphia), Puerto Rico, Texas (including Houston), Virginia, and Washington.
|
TABLE 2. (Continued) Number* of participants and percentage† of persons, by selected characteristics — Medical Monitoring Project, United States, 2009 |
|||
|---|---|---|---|
|
Characteristic |
No. |
% |
(95% CI) |
|
Incarcerated for >24 hours during the past 12 months |
|||
|
Yes |
235 |
5.6 |
(4.6–6.7) |
|
No |
3,979 |
94.4 |
(93.3–95.4) |
|
Health insurance or coverage, past 12 months†† |
|||
|
Yes |
3,441 |
81.1 |
(77.3–84.9) |
|
No |
768 |
18.9 |
(15.1–22.7) |
|
Type of health insurance or coverage, past 12 months |
|||
|
Private health insurance |
|||
|
Yes |
1,248 |
30.6 |
(24.6–36.5) |
|
No |
2,954 |
69.4 |
(63.5–75.4) |
|
Medicaid |
|||
|
Yes |
1,717 |
40.3 |
(35.4–45.2) |
|
No |
2,485 |
59.7 |
(54.8–64.6) |
|
Medicare |
|||
|
Yes |
1,078 |
25.7 |
(23.6–27.9) |
|
No |
3,124 |
74.3 |
(72.1–76.4) |
|
Tricare/CHAMPUS and Veterans Administration |
|||
|
Yes |
65 |
1.4 |
(0.2–2.6) |
|
No |
4,137 |
98.6 |
(97.4–99.8) |
|
Other public insurance |
|||
|
Yes |
222 |
4.8 |
(1.9–7.7) |
|
No |
3,987 |
95.2 |
(92.3–98.1) |
|
Insurance type unknown §§ |
|||
|
Yes |
76 |
2.3 |
(0.9–3.6) |
|
No |
4,133 |
97.7 |
(96.4–99.1) |
|
Primary source of most financial support during the past 12 months |
|||
|
SSI or SSDI |
1,763 |
41.1 |
(37.8–44.4) |
|
Salary or wages |
1,550 |
38.0 |
(34.9–41.1) |
|
Other (including savings , investments, and pensions) |
506 |
11.4 |
(8.9–13.8) |
|
Family, partner, or friends |
343 |
8.4 |
(7.0–9.7) |
|
No income or financial support |
43 |
1.0 |
(0.7–1.3) |
|
Illegal or possibly illegal activities |
8 |
0.2 |
(0.0–0.3) |
|
Combined yearly household income from all sources before taxes in last calendar year |
|||
|
$0–$4,999 |
478 |
10.8 |
(8.7–13.0) |
|
$5,000–$9,999 |
1,043 |
24.5 |
(21.5–27.4) |
|
$10,000–$14,999 |
769 |
18.9 |
(17.3–20.5) |
|
$15,000–$19,999 |
409 |
10.2 |
(9.3–11.1) |
|
$20,000–$29,999 |
440 |
11.2 |
(9.7–12.8) |
|
$30,000–$39,999 |
250 |
6.4 |
(5.3–7.5) |
|
$40,000–$49,999 |
198 |
5.1 |
(4.1–6.0) |
|
$50,000–$74,999 |
222 |
6.0 |
(4.8–7.3) |
|
≥$75,000 |
271 |
6.8 |
(5.3–8.4) |
|
TABLE 2. (Continued) Number* of participants and percentage† of persons, by selected characteristics — Medical Monitoring Project, United States, 2009 |
|||
|---|---|---|---|
|
Characteristic |
No. |
% |
(95% CI) |
|
Poverty guidelines¶¶ |
|||
|
Above poverty guidelines |
2,214 |
56.2 |
(52.0–60.4) |
|
At or below poverty guidelines |
1,866 |
43.8 |
(39.6–48.0) |
|
Total |
4,217 |
— |
— |
|
Abbreviations: CI = confidence interval; GED = general educational development; HIV = human immunodeficiency virus; SSDI = Social Security Disability Insurance; SSI = Social Security Supplemental Income. * The number represents unweighted frequencies. Numbers might not add to total because of missing data. Values exclude categories with fewer than five responses, values with a coefficient of variation >0.30 (30%), responses of "don't know," and skipped (missing) responses. † Percentages are weighted percentages, and CIs are weighted CIs for those percentages. Percentages might not add to 100% because of rounding. § Participants were classified as transgender if sex at birth and gender reported by the participant were different or if the participant chose transgender in response to the question about self-identified gender. ¶ Hispanics or Latinos might be of any race. Participants are classified in only one category. ** McKinney-Vento definition of homelessness: living on the street, living in a shelter, living in a single-room-occupancy hotel, temporarily staying with friends or family, or living in a car. A person is categorized as homeless if that person lacks a fixed, regular, adequate night-time residence or has a steady night-time residence that is 1) a supervised publicly or privately operated shelter designed to provide temporary living accommodation, 2) an institution that provides a temporary residence for persons intended to be institutionalized, or 3) a public or private place not designed for or ordinarily used as a regular sleeping accommodation for human beings (e.g., in an automobile or under a bridge) (Stewart B. McKinney Homeless Assistance Act, 42 U.S.C. §11301, et seq; 1987). †† Participants could select more than one response for health insurance or coverage. Persons were considered uninsured if they reported having health care costs paid for only through Ryan White-funded programs. §§ Unknown insurance type means that although the participant had insurance or coverage, the type of insurance or coverage (e.g., public or private) could not be determined. ¶¶ Poverty guidelines as defined by the U.S. Department of Health and Human Services. The 2008 guidelines were used for patients interviewed in 2009, and the 2009 guidelines were used for patients interviewed in 2010. (Information available at http://aspe.hhs.gov/poverty/faq.cfm.) |
|||
Use of trade names and commercial sources is for identification only and does not imply endorsement by the U.S. Department of
Health and Human Services.
References to non-CDC sites on the Internet are
provided as a service to MMWR readers and do not constitute or imply
endorsement of these organizations or their programs by CDC or the U.S.
Department of Health and Human Services. CDC is not responsible for the content
of pages found at these sites. URL addresses listed in MMWR were current as of
the date of publication.
All MMWR HTML versions of articles are electronic conversions from typeset documents.
This conversion might result in character translation or format errors in the HTML version.
Users are referred to the electronic PDF version (http://www.cdc.gov/mmwr)
and/or the original MMWR paper copy for printable versions of official text, figures, and tables.
An original paper copy of this issue can be obtained from the Superintendent of Documents, U.S.
Government Printing Office (GPO), Washington, DC 20402-9371;
telephone: (202) 512-1800. Contact GPO for current prices.
**Questions or messages regarding errors in formatting should be addressed to
mmwrq@cdc.gov.
