Diagnoses of HIV Infection in the United States and Dependent Areas, 2018: Women

The Special Focus Profiles highlight trends and distribution of HIV in 5 populations of particular interest to HIV prevention programs in state and local health departments: (1) Transgender Persons, (2) Gay, Bisexual, and Other Men Who Have Sex With Men, (3) Persons Who Inject Drugs, (4) Women, and (5) Children Aged <13 Years.
Though HIV diagnoses among women have declined in recent years, more than 7,000 women received an HIV diagnosis in the United States and 6 dependent areas in 2018. One in nine women with HIV are unaware they have it. Because some women may be unaware of their male partner’s risk factors for HIV (such as injection drug use or having sex with men), they may not use condoms or medicines to prevent HIV. Additionally, HIV testing rates within the past year were low among women with sexual behaviors that increase their risk of acquiring HIV and especially low among those who reported anal sex.
Figure 20. Rates of Diagnoses of HIV Infection among Female Adults and Adolescents, 2018—United States and 6 Dependent Areas

In 2018 in the United States and 6 dependent areas, the rate of diagnoses of HIV infection among female adults and adolescents was 5.1 per 100,000 population (Figure 20). The rate of diagnoses for female adults and adolescents ranged from 0.0 per 100,000 in American Samoa, Guam, Northern Mariana Islands, and the Republic of Palau to 19.4 per 100,000 in the District of Columbia, 12.6 in Louisiana, 11.9 in Georgia, 10.3 in Maryland, and 10.0 in Florida.
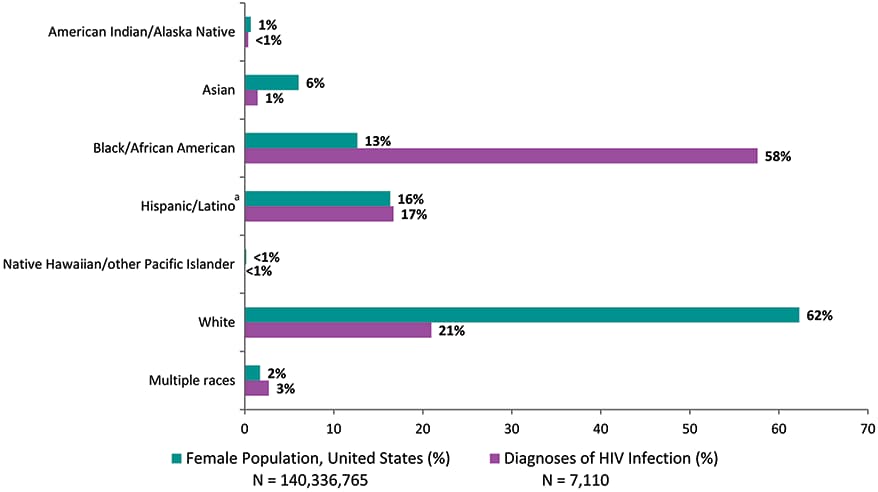
Figure 21. Percentages of Diagnoses of HIV Infection and Population among Female Adults and Adolescents, by Race/Ethnicity, 2018—United States
Note: See Data Tables, Definitions, and Acronyms for more information on race/ethnicity.
a Hispanics/Latinos can be of any race.
In 2018 in the United States, blacks/African Americans made up 13% of the female population but accounted for 58% of diagnoses of HIV infection among females (Figure 21). Whites made up 62% of the female population and accounted for 21% of diagnoses of HIV infection among females. Hispanics/Latinos made up 16% of the female population and accounted for 17% of diagnoses of HIV infection among females. Asians made up 6% of the female population but accounted for 1% of HIV diagnoses among females. Females of multiple races made up 2% of the female population and accounted for 3% of HIV diagnoses among females. Native Hawaiians/other Pacific Islanders and American Indians/Alaska Natives each made up 1% or less of the female population and each accounted for less than 1% of HIV diagnoses among females. Please use caution when interpreting data for American Indian/Alaska Native, Asian, and Native Hawaiian/other Pacific Islander females, and females of multiple races: the numbers are small.
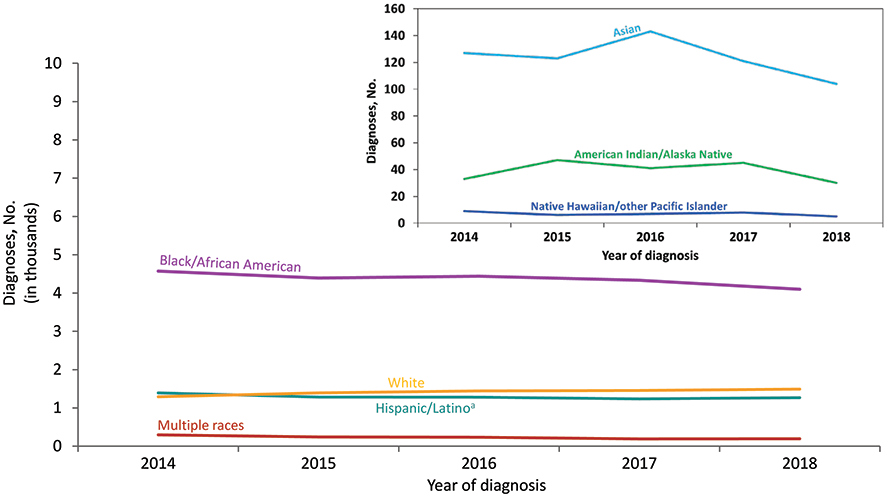
Figure 22. Diagnoses of HIV Infection among Female Adults and Adolescents, by Race/Ethnicity, 2014–2018—United States and 6 Dependent Areas
Note: See Data Tables, Definitions, and Acronyms for more information on race/ethnicity.
a Hispanics/Latinos can be of any race.
From 2014 through 2018 in the United States and 6 dependent areas, black/African American female adults and adolescents accounted for the largest numbers of diagnoses of HIV infection each year although the number decreased from 4,573 in 2014 to 4,097 in 2018 (Figure 22). White and Hispanic/Latino female adults and adolescents had similar numbers of diagnoses of HIV infection each year. In 2018, 1,491 diagnoses of HIV infection were among white females, 1,269 among Hispanic/Latino females, 194 among females of multiple races, 104 among Asian females, 30 among American Indian/Alaska Native females, and 5 among Native Hawaiian/other Pacific Islander females. Please use caution when interpreting data for Native Hawaiian/other Pacific Islander females: the numbers are small.
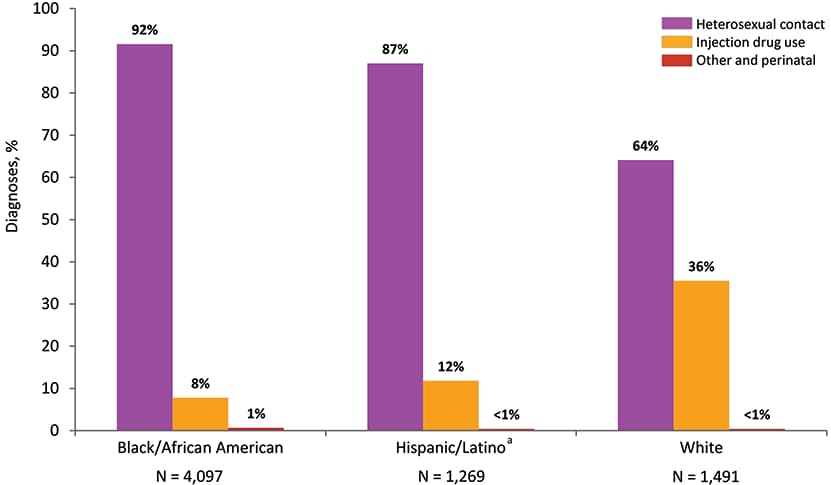
Figure 23. Percentages of Diagnoses of HIV Infection among Female Adults and Adolescents, by Race/Ethnicity and Transmission Category, 2018—United States and 6 Dependent Areas
Note. Data have been statistically adjusted to account for missing transmission category. See Data Tables, Definitions, and Acronyms for more information on race/ethnicity and transmission categories.
a Hispanics/Latinos can be of any race.
In 2018 in the United States and 6 dependent areas, black/African American female adults and adolescents had the largest percentage (92%) of diagnoses of HIV infection attributed to heterosexual contact among females, followed by Hispanic/Latino (87%) and white (64%) females (Figure 23). The percentage (43%) of diagnoses of HIV infection attributed to injection drug use was largest among American Indian/Alaska Native female adults and adolescents, followed by white (35%), Hispanic/Latino (12%) and black/African American (8%) females (Table 2b). The perinatal and “Other” transmission categories accounted for 1% or less of cases among each racial/ethnic group.
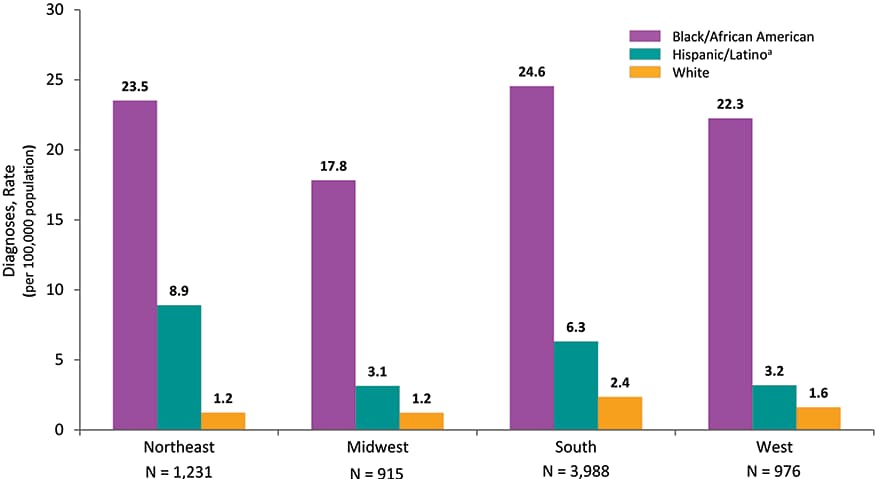
Figure 24. Rates of Diagnoses of HIV Infection among Female Adults and Adolescents, by Region and Race/Ethnicity, 2018—United States
Note: See Data Tables, Definitions, and Acronyms for more information on race/ethnicity and U.S. Census Regions.
a Hispanics/Latinos can be of any race.
Prevalence and Race/Ethnicity
At the end of 2018 in the United States and 6 dependent areas, 245,154 female adults and adolescents were living with diagnosed HIV infection. The majority (58%) of female adults and adolescents living with diagnosed HIV infection were black/African American, 20% were Hispanic/Latino, and 16% were white. Females of multiple races accounted for 5% of females living with diagnosed HIV infection and Asians accounted for 1%. American Indians/Alaska Natives and Native Hawaiians/other Pacific Islanders each accounted for 1% or less of females living with diagnosed HIV infection (Table 16b).
In 2018 in the United States, the South had more diagnoses (3,988) of HIV infection among female adults and adolescents than any other region (Figure 24). The highest rates of diagnoses of HIV infection among black/African American females were in the South (24.6) and in the Northeast (23.5). The highest rate of diagnoses of HIV infection among Hispanic/Latino female adults and adolescents was in the Northeast (8.9). The highest rate of diagnoses of HIV infection among white female adults and adolescents was in the South (2.4).
| American Indian/ Alaska Native |
Asian | Black/African American |
Hispanic/ Latinoa |
Native Hawaiian/ other Pacific Islander |
White | Multiple races |
Total | |
|---|---|---|---|---|---|---|---|---|
| No. | No. | No. | No. | No. | No. | No. | No. | |
| Gender | ||||||||
| Male | 144 | 760 | 11,657 | 8,796 | 60 | 8,025 | 724 | 30,166 |
| Female | 30 | 108 | 4,104 | 1,264 | 5 | 1,482 | 196 | 7,189 |
| Transgender male-to-femaleb | 11 | 10 | 272 | 182 | 3 | 50 | 26 | 554 |
| Transgender female-to-maleb | 0 | 0 | 19 | 11 | 0 | 16 | 1 | 47 |
| Additional gender identityc | 1 | 2 | 3 | 2 | 0 | 2 | 2 | 12 |
| Age at diagnosis (yr) | ||||||||
| <13 | 0 | 5 | 53 | 9 | 0 | 15 | 5 | 87 |
| 13–14 | 0 | 1 | 12 | 5 | 0 | 2 | 0 | 20 |
| 15–19 | 10 | 23 | 1,019 | 381 | 5 | 232 | 49 | 1,719 |
| 20–24 | 29 | 125 | 3,073 | 1,636 | 9 | 1,101 | 179 | 6,152 |
| 25–29 | 35 | 195 | 3,445 | 2,176 | 12 | 1,686 | 219 | 7,768 |
| 30–34 | 32 | 155 | 2,158 | 1,712 | 18 | 1,502 | 146 | 5,723 |
| 35–39 | 21 | 98 | 1,560 | 1,290 | 9 | 1,164 | 108 | 4,250 |
| 40–44 | 14 | 90 | 1,151 | 851 | 2 | 857 | 60 | 3,025 |
| 45–49 | 15 | 73 | 1,015 | 808 | 3 | 887 | 60 | 2,861 |
| 50–54 | 16 | 39 | 964 | 632 | 2 | 822 | 53 | 2,528 |
| 55–59 | 8 | 30 | 776 | 378 | 6 | 654 | 25 | 1,877 |
| 60–64 | 3 | 22 | 454 | 194 | 1 | 363 | 21 | 1,058 |
| ≥65 | 3 | 24 | 375 | 183 | 1 | 290 | 24 | 900 |
| Transmission categoryd | ||||||||
| Male adult or adolescente | ||||||||
| Male-to-male sexual contact | 117 | 685 | 9,444 | 7,653 | 53 | 6,372 | 610 | 24,933 |
| Injection drug use | 8 | 13 | 436 | 350 | 2 | 591 | 36 | 1,434 |
| Male-to-male sexual contact and injection drug use |
23 | 12 | 268 | 343 | 4 | 668 | 54 | 1,372 |
| Heterosexual contactf | 8 | 59 | 1,739 | 624 | 4 | 431 | 50 | 2,916 |
| Perinatalg | 0 | 1 | 8 | 5 | 0 | 0 | 0 | 14 |
| Otherh | 0 | 1 | 10 | 3 | 0 | 7 | 0 | 21 |
| Subtotal | 156 | 771 | 11,905 | 8,977 | 63 | 8,069 | 750 | 30,691 |
| Female adult or adolescente | ||||||||
| Injection drug use | 13 | 4 | 313 | 155 | 0 | 529 | 43 | 1,058 |
| Heterosexual contactf | 17 | 98 | 3,758 | 1,109 | 5 | 956 | 150 | 6,092 |
| Perinatalg | 0 | 1 | 24 | 5 | 0 | 2 | 1 | 33 |
| Otherh | 0 | 1 | 2 | 0 | 0 | 4 | 0 | 7 |
| Subtotal | 30 | 104 | 4,097 | 1,269 | 5 | 1,491 | 194 | 7,190 |
| Child (<13 yrs at diagnosis) | ||||||||
| Perinatal | 0 | 3 | 42 | 6 | 0 | 9 | 5 | 65 |
| Otherh | 0 | 2 | 11 | 3 | 0 | 6 | 0 | 22 |
| Subtotal | 0 | 5 | 53 | 9 | 0 | 15 | 5 | 87 |
| Region of residencei | ||||||||
| Northeast | 7 | 184 | 2,214 | 1,738 | 4 | 1,253 | 182 | 5,582 |
| Midwest | 25 | 80 | 2,342 | 658 | 2 | 1,693 | 137 | 4,937 |
| South | 43 | 237 | 10,113 | 4,270 | 13 | 4,346 | 444 | 19,466 |
| West | 111 | 375 | 1,378 | 3,154 | 47 | 2,280 | 185 | 7,530 |
| U.S. dependent areas | 0 | 4 | 8 | 435 | 2 | 3 | 1 | 453 |
| Total | 186 | 880 | 16,055 | 10,255 | 68 | 9,575 | 949 | 37,968 |
Note: Numbers less than 12 should be interpreted with caution.
aHispanics/Latinos can be of any race.
b“Transgender male-to-female” includes individuals who were assigned “male” sex at birth but have ever identified as “female” gender. “Transgender female-to-male” includes individuals who were assigned “female” sex at birth but have ever identified as “male” gender.
cAdditional gender identity examples include “bigender,” “gender queer,” and “two-spirit.”
dData have been statistically adjusted to account for missing transmission category, therefore values may not sum to column subtotals and total.
eData presented based on sex at birth and includes transgender persons.
fHeterosexual contact with a person known to have, or to be at high risk for, HIV infection.
gIndividuals were ≥13 years of age at time of diagnosis of HIV infection.
hIncludes hemophilia, blood transfusion, and risk factor not reported or not identified.
iData are based on residence at time of diagnosis of HIV infection.
| 2014 | 2015 | 2016 | 2017 | 2018 | ||||||
|---|---|---|---|---|---|---|---|---|---|---|
| No. | Ratea | No. | Ratea | No. | Ratea | No. | Ratea | No. | Ratea | |
| Male adult or adolescent | ||||||||||
| Age at end of year | ||||||||||
| 13–14 | 338 | 7.8 | 339 | 7.9 | 311 | 7.3 | 300 | 7.0 | 298 | 6.9 |
| 15–19 | 3,234 | 29.6 | 3,153 | 28.9 | 2,975 | 27.2 | 2,968 | 27.2 | 2,870 | 26.3 |
| 20–24 | 25,572 | 215.4 | 25,049 | 212.6 | 24,441 | 210.3 | 23,337 | 203.8 | 22,208 | 196.1 |
| 25–29 | 49,933 | 443.0 | 54,062 | 469.4 | 57,313 | 486.4 | 59,562 | 495.9 | 60,197 | 495.8 |
| 30–34 | 56,421 | 517.0 | 59,231 | 539.2 | 63,048 | 568.0 | 66,964 | 599.1 | 72,244 | 639.9 |
| 35–39 | 60,573 | 603.5 | 63,553 | 619.2 | 66,416 | 632.4 | 69,106 | 645.5 | 71,519 | 656.6 |
| 40–44 | 78,699 | 762.9 | 73,008 | 721.8 | 69,801 | 705.8 | 69,072 | 702.2 | 69,802 | 704.8 |
| 45–49 | 113,544 | 1087.6 | 108,762 | 1044.1 | 103,144 | 983.9 | 97,283 | 928.8 | 91,489 | 881.8 |
| 50–54 | 128,505 | 1150.2 | 130,958 | 1185.2 | 130,857 | 1207.5 | 127,596 | 1202.3 | 122,694 | 1,180.7 |
| 55–59 | 92,901 | 881.9 | 99,975 | 936.1 | 106,365 | 986.3 | 113,169 | 1048.7 | 120,127 | 1,114.1 |
| 60–64 | 56,903 | 635.0 | 62,380 | 678.6 | 68,750 | 730.9 | 75,243 | 780.5 | 81,375 | 827.4 |
| ≥65 | 47,226 | 229.3 | 54,641 | 256.1 | 62,351 | 282.3 | 70,911 | 310.5 | 80,375 | 340.4 |
| Race/ethnicity | ||||||||||
| American Indian/Alaska Native | 1,833 | — | 1,923 | — | 2,066 | — | 2,202 | — | 2,330 | — |
| Asianb | 9,292 | — | 10,078 | — | 10,855 | — | 11,692 | — | 12,480 | — |
| Black/African American | 248,781 | — | 257,019 | — | 265,011 | — | 272,573 | — | 280,271 | — |
| Hispanic/Latinoc | 170,439 | — | 177,408 | — | 184,644 | — | 191,552 | — | 198,525 | — |
| Native Hawaiian/other Pacific Islander | 585 | — | 645 | — | 673 | — | 716 | — | 770 | — |
| White | 247,151 | — | 251,790 | — | 255,899 | — | 260,005 | — | 264,082 | — |
| Multiple races | 35,210 | — | 35,695 | — | 36,075 | — | 36,223 | — | 36,192 | — |
| Region of residenced | ||||||||||
| Northeast | 157,901 | 687.6 | 159,774 | 694.3 | 163,147 | 707.6 | 165,015 | 714.5 | 167,050 | 721.6 |
| Midwest | 86,965 | 314.2 | 89,131 | 321.0 | 92,052 | 330.3 | 94,528 | 337.8 | 97,029 | 345.4 |
| South | 301,247 | 622.7 | 312,670 | 638.2 | 321,425 | 648.0 | 331,976 | 661.9 | 342,391 | 675.4 |
| West | 156,101 | 506.9 | 161,785 | 518.6 | 167,372 | 529.6 | 172,362 | 539.1 | 177,146 | 547.9 |
| U.S. dependent areas | 11,635 | 738.1 | 11,751 | 754.3 | 11,776 | 766.5 | 11,630 | 768.8 | 11,582 | 787.1 |
| Subtotal | 713,849 | 543.3 | 735,111 | 554.7 | 755,772 | 565.4 | 775,511 | 575.7 | 795,198 | 585.8 |
| Female adult or adolescent | ||||||||||
| Age at end of year | ||||||||||
| 13–14 | 407 | 9.8 | 390 | 9.5 | 367 | 9.0 | 374 | 9.1 | 374 | 9.1 |
| 15–19 | 2,115 | 20.3 | 1,862 | 17.8 | 1,695 | 16.2 | 1,582 | 15.1 | 1,493 | 14.3 |
| 20–24 | 6,486 | 57.4 | 6,119 | 54.8 | 5,699 | 51.8 | 5,346 | 49.2 | 4,976 | 46.1 |
| 25–29 | 11,904 | 108.9 | 11,879 | 106.6 | 11,799 | 103.6 | 11,562 | 99.9 | 11,347 | 97.3 |
| 30–34 | 18,495 | 170.7 | 17,595 | 161.7 | 17,124 | 156.4 | 16,831 | 153.4 | 16,476 | 149.1 |
| 35–39 | 25,086 | 248.6 | 24,917 | 242.0 | 24,684 | 234.5 | 24,125 | 225.2 | 23,488 | 215.8 |
| 40–44 | 31,619 | 301.7 | 30,266 | 294.5 | 29,451 | 293.3 | 28,782 | 288.3 | 28,704 | 286.1 |
| 45–49 | 36,847 | 346.0 | 36,568 | 344.6 | 35,840 | 335.3 | 35,430 | 331.6 | 34,401 | 324.4 |
| 50–54 | 37,784 | 325.5 | 38,754 | 337.7 | 39,207 | 349.1 | 38,826 | 353.4 | 38,437 | 358.0 |
| 55–59 | 28,309 | 253.2 | 30,430 | 269.0 | 32,348 | 283.4 | 34,302 | 300.5 | 36,110 | 316.7 |
| 60–64 | 16,533 | 168.7 | 18,536 | 184.4 | 20,767 | 202.0 | 22,969 | 218.1 | 25,266 | 235.6 |
| ≥65 | 13,631 | 52.0 | 15,843 | 58.7 | 18,240 | 65.6 | 21,044 | 73.4 | 24,082 | 81.6 |
| Race/ethnicity | ||||||||||
| American Indian/Alaska Native | 685 | — | 716 | — | 749 | — | 781 | — | 799 | — |
| Asianb | 2,064 | — | 2,204 | — | 2,364 | — | 2,502 | — | 2,632 | — |
| Black/African American | 132,219 | — | 134,551 | — | 137,014 | — | 139,494 | — | 141,880 | — |
| Hispanic/Latinoc | 45,704 | — | 46,446 | — | 47,144 | — | 47,821 | — | 48,562 | — |
| Native Hawaiian/other Pacific Islander | 129 | — | 135 | — | 137 | — | 141 | — | 143 | — |
| White | 37,043 | — | 37,720 | — | 38,446 | — | 39,121 | — | 39,878 | — |
| Multiple races | 11,151 | — | 11,167 | — | 11,147 | — | 11,094 | — | 11,041 | — |
| Region of residenced | ||||||||||
| Northeast | 67,085 | 272.6 | 67,361 | 273.4 | 68,124 | 276.3 | 68,325 | 276.8 | 68,614 | 277.5 |
| Midwest | 22,757 | 78.8 | 23,256 | 80.4 | 23,997 | 82.7 | 24,670 | 84.8 | 25,343 | 86.8 |
| South | 111,320 | 217.8 | 113,767 | 219.8 | 115,542 | 220.5 | 118,068 | 222.8 | 120,394 | 224.6 |
| West | 22,833 | 72.9 | 23,602 | 74.4 | 24,438 | 76.1 | 25,118 | 77.4 | 25,865 | 78.8 |
| U.S. dependent areas | 5,221 | 299.1 | 5,173 | 299.3 | 5,120 | 299.4 | 4,992 | 296.5 | 4,938 | 301.7 |
| Subtotal | 229,216 | 166.5 | 233,159 | 168.0 | 237,221 | 169.6 | 241,173 | 171.1 | 245,154 | 172.7 |
| Total | 943,065 | 350.5 | 968,270 | 356.9 | 992,993 | 363.0 | 1,016,684 | 368.8 | 1,040,352 | 374.6 |
Note: Data for the year 2018 are preliminary and based on deaths reported to CDC as of December 2019.
aRates are per 100,000 population. Rates by race/ethnicity are not provided because U.S. census information is limited for U.S. dependent areas.
bIncludes Asian/Pacific Islander legacy cases (see Technical Notes).
cHispanics/Latinos can be of any race.
dData are based on address of residence at the end of the specified year (i.e., most recent known address).
In the Federal Register [6] for October 30, 1997, the Office of Management and Budget (OMB) announced the Revisions to the Standards for the Classification of Federal Data on Race and Ethnicity. Implementation by January 1, 2003 was mandated. At a minimum, data on the following race categories should be collected:
- American Indian or Alaska Native
- Asian
- black or African American
- Native Hawaiian or other Pacific Islander
- white
Additionally, systems must be able to retain information when multiple race categories are reported. In addition to data on race, data on 2 categories of ethnicity should be collected:
- Hispanic or Latino
- not Hispanic or Latino
The Asian or Pacific Islander category displayed in annual surveillance reports published prior to the 2007 surveillance report was split into 2 categories: (1) Asian and (2) Native Hawaiian or other Pacific Islander. The Asian category (in tables where footnoted) includes the cases in Asians/Pacific Islanders (referred to as legacy cases) that were reported before the implementation of the new race categories in 2003 (e.g., cases of HIV infection that were diagnosed and reported to CDC before 2003 but that were classified as stage 3 [AIDS] after 2003) and a small percentage of cases that were reported after 2003 but that were reported according to the old race category (Asian/ Pacific Islander). In tables of diagnoses of HIV infection during 2014–2018, the Asian category does not include Asian/Pacific Islander cases because these cases were diagnosed after 2003 and were reported to CDC in accordance with OMB’s Revisions to the Standards for the Classification of Federal Data on Race and Ethnicity [6].
This report also presents data for persons for whom multiple race categories are reported. In this report, persons categorized by race were not Hispanic or Latino. The number of persons reported in each race category may, however, include persons whose ethnicity was not reported.
Transmission category is the term for the classification of cases that summarizes an adult’s or adolescent’s possible HIV risk factors; the summary classification results from selecting, from the presumed hierarchical order of probability, the 1 (single) risk factor most likely to have been responsible for transmission. For surveillance purposes, a diagnosis of HIV infection is counted only once in the hierarchy of transmission categories [7]. Adults or adolescents with more than 1 reported risk factor for HIV infection are classified in the transmission category listed first in the hierarchy. The exception is men who had sexual contact with other men and injected drugs; this group makes up a separate transmission category.
Hierarchical Categories:
- Male-to-male sexual contact: men who have had sexual contact with men (i.e., homosexual contact) and men who have had sexual contact with both men and women (i.e., bisexual contact)
- Injection drug use (IDU): persons who have injected non-prescription drugs
- Male-to-male sexual contact and injection drug use (male-to-male sexual contact and IDU): men who have had sexual contact with other men and injected non-prescription drugs
- Heterosexual contact: persons who have ever had heterosexual contact with a person known to have, or to be at high risk for, HIV infection
- Perinatal: persons infected through perinatal transmission but aged 13 years and older at time of diagnosis of HIV infection. Prevalence data and tables of death data includes persons infected through perinatal transmission but aged 13 years and older during the specified year or at death.
- Other: all other transmission categories (e.g., blood transfusion, hemophilia, risk factor not reported or not identified).
Cases of HIV infection reported without a risk factor listed in the hierarchy of transmission categories are classified as “no identified risk (NIR).” Cases classified as NIR include cases that are being followed up by local health department staff; cases in persons whose risk-factor information is missing because they died, declined to be interviewed, or were lost to follow-up; and cases in persons who were interviewed or for whom other follow-up information was available but for whom no risk factor was identified.
Because a substantial proportion of cases of HIV infection are reported to CDC without an identified risk factor, multiple imputation is used to assign a transmission category to these cases [7]. Multiple imputation is a statistical approach in which each missing transmission category is replaced with a set of plausible values that represent the uncertainty about the true, but missing, value [8]. Each resulting data set containing the plausible values is analyzed by using standard procedures, and the results from these analyses are then combined to produce the final results. In tables displaying transmission categories, multiple imputation was used for adults and adolescents, but not for children (because the number of cases in children is small, missing transmission categories were not imputed).
Data by region reflect the address at the time of diagnosis of HIV infection for figures and tables that present number of diagnoses (Figures 17, 19, 24; Tables 1a/b–7a/b). For tables presenting prevalence data (14a/b–17a/b), region is based on most recent known address as of the end of the specified year. For the death tables (10a/b–13a/b), region is based on residence at death. When information on residence at death is not available, the state where a person’s death occurred is used.
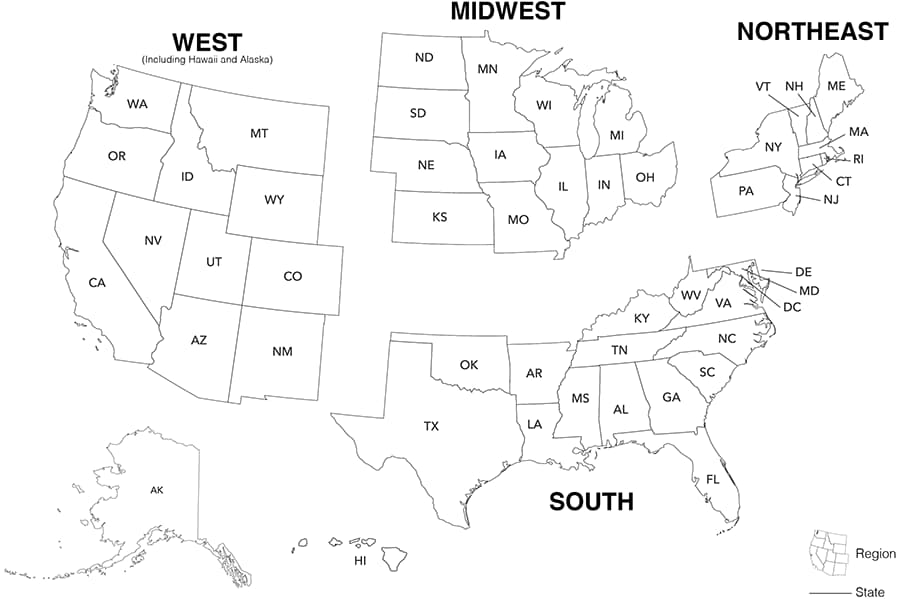
The 4 regions of residence and 6 dependent areas used in this report are defined by the U.S. Census Bureau as follows:
- Northeast: Connecticut, Maine, Massachusetts, New Hampshire, New Jersey, New York, Pennsylvania, Rhode Island, and Vermont
- Midwest: Illinois, Indiana, Iowa, Kansas, Michigan, Minnesota, Missouri, Nebraska, North Dakota, Ohio, South Dakota, and Wisconsin
- South: Alabama, Arkansas, Delaware, District of Columbia (D.C.), Florida, Georgia, Kentucky, Louisiana, Maryland, Mississippi, North Carolina, Oklahoma, South Carolina, Tennessee, Texas, Virginia, and West Virginia
- West: Alaska, Arizona, California, Colorado, Hawaii, Idaho, Montana, Nevada, New Mexico, Oregon, Utah, Washington, and Wyoming
- U.S. dependent areas: American Samoa, Guam, the Northern Mariana Islands, Puerto Rico, the Republic of Palau, and the U.S. Virgin Islands
AGI: additional gender identity
AIDS: acquired immunodeficiency syndrome
CDC: Centers for Disease Control and Prevention
FTM: female-to-male
HIV: human immunodeficiency virus
IDU: injection drug use
MSA: metropolitan statistical area
MSM: gay, bisexual, and other men who have sex with men
MTF: male-to-female
NHSS: National HIV Surveillance System
NIR: no identified risk factor
OI: opportunistic illness
OMB: Office of Management and Budget
PrEP: preexposure prophylaxis
PWID: persons who inject drugs