Diagnoses of HIV Infection in the United States and Dependent Areas, 2018: Technical Notes


This report includes case report data from 50 states, the District of Columbia, and 6 U.S. dependent areas (American Samoa, Guam, the Northern Mariana Islands, Puerto Rico, the Republic of Palau, and the U.S. Virgin Islands) in which laws or regulations require confidential reporting to the jurisdiction (not to CDC), by name, for adults, adolescents, and children with confirmed diagnoses of HIV infection. After the removal of personally identifiable information, data from these reports were submitted to CDC. Although AIDS cases have been reported to CDC since 1981, the date of implementation of HIV infection reporting has differed from jurisdiction to jurisdiction. All states, the District of Columbia, and 6 U.S. dependent areas had fully implemented name-based HIV infection reporting by April 2008.
Data re-release agreements between CDC and state/local HIV surveillance programs require specific levels of cell suppression at the state and county level in order to ensure confidentiality of personally identifiable information. Please use caution when interpreting data on diagnoses of HIV infection. HIV surveillance reports may not be representative of all persons with HIV because not all infected persons have been (1) tested or (2) tested at a time when the infection could be detected and diagnosed. Also, some states offer anonymous HIV testing; the results of anonymous tests are not reported to the confidential name-based HIV registries of state and local health departments. Therefore, reports of confidential test results may not represent all persons who tested positive for HIV infection. In addition, testing patterns are influenced by many factors, including the extent to which testing is routinely offered to specific groups and the availability of, and access to, medical care and testing services. The data presented in this report provide minimum counts of persons for whom HIV infection has been diagnosed and reported to the surveillance system. Finally, although all jurisdictions use a uniform case report form, surveillance practices in data collection and updating of case records may differ among jurisdictions.
Based on annual standard evaluation results, the completeness of reporting of HIV infection, as of December 2018, is estimated to be at least 85% in all but 1 jurisdiction [1].
Both the 2008 and 2014 HIV case definitions were used to classify HIV infection among adults and adolescents and among children [2, 3]. In the following lists, some bulleted items are paraphrases, not quotations, from the published surveillance case definitions. The intention is to emphasize the differences between the 2008 and 2014 case definitions.
The 2008 case definition was used to classify cases diagnosed through 2013. For adults and adolescents, this definition incorporates an HIV infection staging system that includes AIDS (HIV infection, stage 3). The 2008 stages of HIV infection are defined as follows:
- HIV infection, stage 1: No AIDS-defining opportunistic illness (OI) and either CD4+ T- lymphocyte (CD4 lymphocyte) count of ≥500 cells/mL or CD4 percentage of total lymphocytes of ≥29.
- HIV infection, stage 2: No AIDS-defining OI and either CD4 lymphocyte count of 200–499 cells/mL or CD4 percentage of total lymphocytes of 14–28.
- HIV infection, stage 3 (AIDS): Documentation of an AIDS-defining OI or either a CD4 lymphocyte count of <200 cells/mL or CD4 percentage of total lymphocytes of <14. Documentation of an AIDS-defining OI supersedes a CD4 lymphocyte count or percentage that would not, by itself, be the basis for a stage 3 (AIDS).
- HIV infection, stage unknown: No reported information on AIDS-defining OIs and no information available on CD4 lymphocyte count or percentage.
The 2014 case definition was used to classify cases diagnosed in 2014 and later. It is similar to the 2008 case definition except for the following: (1) inclusion of criteria for stage 0, (2) the inclusion of CD4 lymphocyte testing criteria for stage 3 in children, and (3) changes in the cutoffs for CD4 percentage of total lymphocytes used for classification of stages 1 and 2 in persons aged 6 years and older [3]. The stages of HIV infection in the 2014 case definition are based on age-specific CD4 lymphocyte counts or percentages of total lymphocytes and are defined as follows:
- HIV infection, stage 0: First positive HIV test result within 6 months after a negative HIV test result. The stage remains stage 0 until 6 months after the first positive test result. After 6 months, the stage may be classified as 1, 2, 3, or unknown if based on a CD4 test result or the diagnosis of an OI. The diagnosis of an AIDS-defining condition or a low CD4 test result before the 6 months have elapsed does not change the stage from stage 0 to stage 3.
- HIV infection, stages 1, 2, and 3: Documentation of an AIDS-defining OI (excluding stage 0 as described above) is stage 3. Otherwise, the stage is determined by the lowest CD4 lymphocyte test result:
- Stage 1 CD4 lymphocyte count of ≥500 or a CD4 percentage of total lymphocytes of ≥26
- Stage 2 CD4 lymphocyte count of 200–499 or a CD4 percentage of total lymphocytes of 14–25
- Stage 3 CD4 lymphocyte count of <200 or a CD4 percentage of total lymphocytes of <14 or documentation of an AIDS-defining condition.
- HIV infection, stage unknown: No reported information on AIDS-defining OIs and no information available on CD4 lymphocyte count or percentage.
The transition to CD4 lymphocyte-based criteria for stage 3 (AIDS) among children has resulted in an increase in the number of annual stage 3 (AIDS) classifications among pediatric cases diagnosed after 2013. Before implementation of the 2014 revised case definition, an OI diagnosis was required for a pediatric case to meet the criteria for stage 3 classification.
The data in this report include information received by CDC through December 31, 2019. The data are organized into 2 sections: National Profile and Special Focus Profiles. For both the National and Special Focus Profiles, figures are presented. For the National Profile, tables are presented in the Tables section in 2 formats. Tables in the first format—labeled “a”—exclude data from the dependent areas (American Samoa, Guam, the Northern Mariana Islands, Puerto Rico, the Republic of Palau, and the U.S. Virgin Islands). Tables in the second format—labeled “b”—include data from the dependent areas.
Please use caution when interpreting numbers less than 12, and rates and trends based on these numbers.
In this report, the term diagnosis of HIV infection is defined as a diagnosis of HIV infection regardless of the stage of disease (stage 0, 1, 2, 3 [AIDS], or unknown) and refers to all persons with a diagnosis of HIV infection.
The data on diagnoses of HIV infection reflect the date of diagnosis (diagnosed by December 31, 2018; reported to CDC as of December 31, 2019), not the date of report to CDC. HIV surveillance data may not be representative of all persons infected with HIV because not all infected persons have been (1) tested or (2) tested at a time when their infection could be detected and diagnosed. Because of reporting delays, the number of cases diagnosed in a given year may be lower than the numbers presented in later reports; however, fluctuations in the number of diagnoses for a calendar year typically subside after 2 to 3 years of reporting.
This report is based on diagnoses of HIV infection that the 50 states, the District of Columbia, and 6 U.S. dependent areas reported to CDC as of December 31, 2019. Data from all areas are included in figures and tables displaying numbers and rates of diagnoses of HIV infection and of stage 3 (AIDS) classifications, by selected characteristics, area of residence, and metropolitan statistical area (MSA) (Figures 1–6, 11–26, 28, and 29; Tables 1a/b–9, 18, 20, and A1). For tables presenting diagnosis data, region or area of residence reflects the address at the time of HIV diagnosis.
Persons reported to the National HIV Surveillance System are assumed alive unless their deaths have been reported to CDC. Death data include deaths of persons with diagnosed HIV infection (Figures 7 and 8; Tables 10a/b–13a/b) regardless of the cause of death. Death data are based on a 12-month reporting delay to allow data to be reported to CDC. For the death tables, region or area of residence is based on residence at death. When information on residence at death is not available, the state where a person’s death occurred is used. Data for the year 2018 are preliminary and based on death data received by CDC through December 2019. Trends through 2018 should be interpreted with caution. Due to incomplete reporting of deaths for the year 2018, death data for Alabama, Oklahoma, South Carolina, and the U.S. Virgin Islands should be interpreted with caution.
Prevalence trends and data reflect persons living with diagnosed HIV infection, regardless of stage of disease, (Figures 9, 10, 30, and 31; Tables 14a/b–17a/b, 19, 20, and A2) at the end of a given year during 2014–2018. Because of delays in the reporting of deaths, prevalence data are based on a 12-month reporting delay to allow data to be reported to CDC. For tables presenting prevalence data, region or area of residence is based on most recent known address as of the end of the specified year. Data for the year 2018 are preliminary and based on death data received by CDC through December 2019. Trends through 2018 should be interpreted with caution. Due to incomplete reporting of deaths for the year 2018, prevalence data for Alabama, Oklahoma, South Carolina, and the U.S. Virgin Islands should be interpreted with caution.
Rates per 100,000 population were calculated for (1) the numbers of diagnoses of HIV infection, (2) the numbers of deaths of persons with diagnosed HIV infection, and (3) the numbers of persons living with diagnosed HIV infection.
The population denominators used to compute the rates for the 50 states, the District of Columbia, and Puerto Rico were based on the Vintage 2018 postcensal estimates file (for years 2014–2018) from the U.S. Census Bureau [4]. The population denominators for American Samoa, Guam, the Northern Mariana Islands, the Republic of Palau, and the U.S. Virgin Islands were based on estimates and projections from the U.S. Census Bureau’s International Data Base [5]. Each rate was calculated by dividing the total number of diagnoses (or deaths or prevalence) for the calendar year by the population for that calendar year and then multiplying the result by 100,000. The denominators used for calculating the rates specific to age, sex, and race/ethnicity were computed by applying the appropriate vintage estimates for age, sex, and race/ethnicity for the 50 states and the District of Columbia [4]. The same method was used to calculate the denominators for Puerto Rico, with the exception of race/ethnicity estimates; these data are not available for Puerto Rico (see next paragraph). For the other 5 U.S. dependent areas, estimates from the U.S. Census Bureau’s International Data Base were used for age- and sex-specific population denominators [5].
CDC currently does not provide subpopulation rates by race/ethnicity for the 6 U.S. dependent areas because the U.S. Census Bureau does not collect information from all dependent areas. Rates for gender and transmission categories are not provided in this report because of the absence of denominator data from the U.S. Census Bureau, the source of data used for calculating all rates in this report.
The designation “adults and adolescents” refers to persons aged 13 years and older; the designation “children” refers to persons aged less than 13 years. For presentations of data on persons living with diagnosed HIV infection (Tables 14a/b–17a/b), the age-group assignment (e.g., 20–24 years) or the age designation (e.g., “adults and adolescents”) is based on the person’s age as of December 31 of the specified year. For presentations of data on deaths of persons with diagnosed HIV infection (Tables 10a/b–13a/b), age-group assignment is determined by the person’s age at the time of death. For all other tables, the age designation or the specific age-group assignment is based on the person’s age at the time of HIV diagnosis.
Age-group designations for transmission categories in figures and tables displaying data on prevalence and on deaths are based on a person’s age at the end of the specified year or age at death, respectively. The transmission categories among “adults and adolescents” in these tables include persons who were children at the time of diagnosis but who were aged 13 years and older during the specified year or at death.
Sex designations in this report are based on a person’s sex at birth.
Gender identity refers to a person’s internal understanding of their own gender, or gender with which a person identifies. HIV surveillance personnel collect data on gender identity, when available, from sources such as case report forms submitted by health care or HIV testing providers and medical records, or by matching with other health department databases (e.g., Ryan White program data). In May 2013, CDC issued guidance to state and local programs on methods for collecting data on transgender persons and working with transgender-specific data. However, characterization of HIV infection among transgender persons may require supplemental data from special studies. A person’s transgender status in NHSS is determined based on two variables – sex assigned at birth and current gender identity. Both variables are examined, using a two-step approach, to assess transgender status. Although not used in this report, cisgender is a term used to indicate that a person’s sex assigned at birth and current gender identity are the same (i.e., a person assigned male at birth and who currently identifies as a man, is a cisgender male).
Categories
- Male: persons assigned “male” sex at birth and current gender identity is not “transgender male-to-female” or “additional gender identity” (current gender identity can be listed as “male,” “female,” “transgender female-to-male,” “unspecified,” or left blank).
- Female: persons assigned “female” sex at birth and current gender identity is not “transgender female-to-male” or “additional gender identity” (current gender identity can be listed as “male,” “female,” “transgender male-to-female,” “unspecified,” or left blank).
- Transgender male-to-female (transgender MTF): persons assigned “male” sex at birth and current gender identity is “transgender male-to-female.”
- Transgender female-to-male (transgender FTM): persons assigned “female” sex at birth and current gender identity is “transgender female-to-male.”
- Additional gender identity (AGI): persons assigned “male” or “female” sex at birth and current gender identity is “additional gender identity.” AGI includes “bigender,” “gender queer,” and “two-spirit.”
In the Federal Register [6] for October 30, 1997, the Office of Management and Budget (OMB) announced the Revisions to the Standards for the Classification of Federal Data on Race and Ethnicity. Implementation by January 1, 2003 was mandated. At a minimum, data on the following race categories should be collected:
- American Indian or Alaska Native
- Asian
- black or African American
- Native Hawaiian or other Pacific Islander
- white
Additionally, systems must be able to retain information when multiple race categories are reported. In addition to data on race, data on 2 categories of ethnicity should be collected:
- Hispanic or Latino
- not Hispanic or Latino
The Asian or Pacific Islander category displayed in annual surveillance reports published prior to the 2007 surveillance report was split into 2 categories: (1) Asian and (2) Native Hawaiian or other Pacific Islander. The Asian category (in tables where footnoted) includes the cases in Asians/Pacific Islanders (referred to as legacy cases) that were reported before the implementation of the new race categories in 2003 (e.g., cases of HIV infection that were diagnosed and reported to CDC before 2003 but that were classified as stage 3 [AIDS] after 2003) and a small percentage of cases that were reported after 2003 but that were reported according to the old race category (Asian/ Pacific Islander). In tables of diagnoses of HIV infection during 2014–2018, the Asian category does not include Asian/Pacific Islander cases because these cases were diagnosed after 2003 and were reported to CDC in accordance with OMB’s Revisions to the Standards for the Classification of Federal Data on Race and Ethnicity [6].
This report also presents data for persons for whom multiple race categories are reported. In this report, persons categorized by race were not Hispanic or Latino. The number of persons reported in each race category may, however, include persons whose ethnicity was not reported.
Transmission category is the term for the classification of cases that summarizes an adult’s or adolescent’s possible HIV risk factors; the summary classification results from selecting, from the presumed hierarchical order of probability, the 1 (single) risk factor most likely to have been responsible for transmission. For surveillance purposes, a diagnosis of HIV infection is counted only once in the hierarchy of transmission categories [7]. Adults or adolescents with more than 1 reported risk factor for HIV infection are classified in the transmission category listed first in the hierarchy. The exception is men who had sexual contact with other men and injected drugs; this group makes up a separate transmission category.
Hierarchical Categories:
- Male-to-male sexual contact: men who have had sexual contact with men (i.e., homosexual contact) and men who have had sexual contact with both men and women (i.e., bisexual contact)
- Injection drug use (IDU): persons who have injected non-prescription drugs
- Male-to-male sexual contact and injection drug use (male-to-male sexual contact and IDU): men who have had sexual contact with other men and injected non-prescription drugs
- Heterosexual contact: persons who have ever had heterosexual contact with a person known to have, or to be at high risk for, HIV infection
- Perinatal: persons infected through perinatal transmission but aged 13 years and older at time of diagnosis of HIV infection. Prevalence data and tables of death data includes persons infected through perinatal transmission but aged 13 years and older during the specified year or at death.
- Other: all other transmission categories (e.g., blood transfusion, hemophilia, risk factor not reported or not identified).
Cases of HIV infection reported without a risk factor listed in the hierarchy of transmission categories are classified as “no identified risk (NIR).” Cases classified as NIR include cases that are being followed up by local health department staff; cases in persons whose risk-factor information is missing because they died, declined to be interviewed, or were lost to follow-up; and cases in persons who were interviewed or for whom other follow-up information was available but for whom no risk factor was identified.
Because a substantial proportion of cases of HIV infection are reported to CDC without an identified risk factor, multiple imputation is used to assign a transmission category to these cases [7]. Multiple imputation is a statistical approach in which each missing transmission category is replaced with a set of plausible values that represent the uncertainty about the true, but missing, value [8]. Each resulting data set containing the plausible values is analyzed by using standard procedures, and the results from these analyses are then combined to produce the final results. In tables displaying transmission categories, multiple imputation was used for adults and adolescents, but not for children (because the number of cases in children is small, missing transmission categories were not imputed).
Data by region reflect the address at the time of diagnosis of HIV infection for figures and tables that present number of diagnoses (Figures 17, 19, 24; Tables 1a/b–7a/b). For tables presenting prevalence data (14a/b–17a/b), region is based on most recent known address as of the end of the specified year. For the death tables (10a/b–13a/b), region is based on residence at death. When information on residence at death is not available, the state where a person’s death occurred is used.
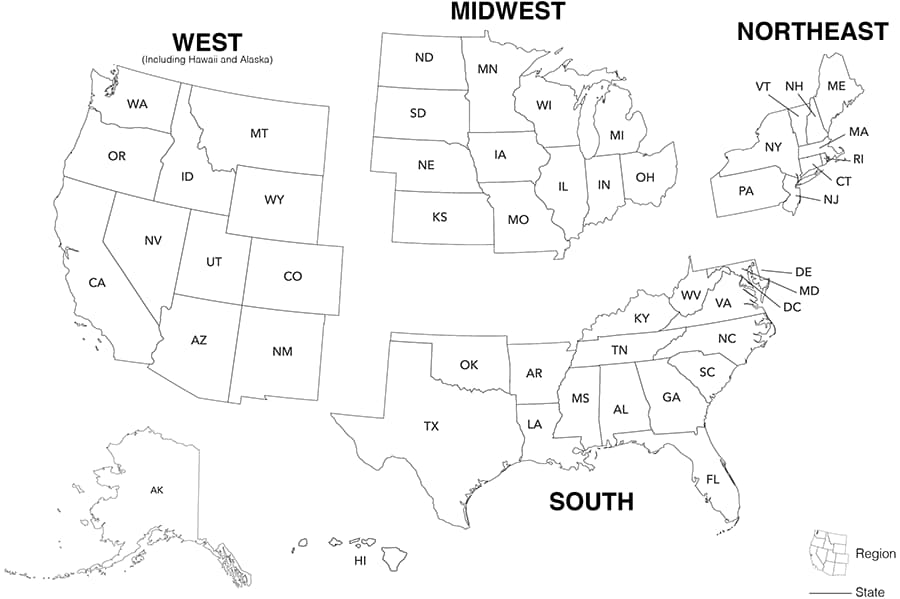
The 4 regions of residence and 6 dependent areas used in this report are defined by the U.S. Census Bureau as follows:
- Northeast: Connecticut, Maine, Massachusetts, New Hampshire, New Jersey, New York, Pennsylvania, Rhode Island, and Vermont
- Midwest: Illinois, Indiana, Iowa, Kansas, Michigan, Minnesota, Missouri, Nebraska, North Dakota, Ohio, South Dakota, and Wisconsin
- South: Alabama, Arkansas, Delaware, District of Columbia (D.C.), Florida, Georgia, Kentucky, Louisiana, Maryland, Mississippi, North Carolina, Oklahoma, South Carolina, Tennessee, Texas, Virginia, and West Virginia
- West: Alaska, Arizona, California, Colorado, Hawaii, Idaho, Montana, Nevada, New Mexico, Oregon, Utah, Washington, and Wyoming
- U.S. dependent areas: American Samoa, Guam, the Northern Mariana Islands, Puerto Rico, the Republic of Palau, and the U.S. Virgin Islands
In the Federal Register for June 28, 2010, OMB published revised standards for defining MSAs in federal statistical activities [9]. These standards, which provided for the identification of MSAs in the United States and Puerto Rico, replaced the 2000 standards. The adoption of the new standards was effective as of June 28, 2010. On February 28, 2013, OMB announced new MSA delineations based on the new standards and Census 2010 data [10]. Table 20 (data on diagnosed HIV infection and prevalence of diagnosed HIV infection) present numbers and rates of diagnoses and prevalence, by MSA, for areas with populations of 500,000 or more. The MSAs listed in these tables were defined according to OMB’s most recent update (February 2013) of statistical areas [10].
- Karch DL, Chen M, Tang T. Evaluation of the National Human Immunodeficiency Virus Surveillance System for the 2011 diagnosis yearexternal icon. J Public Health Manag Pract 2014;20(6):598–607. doi: 10.1097/ PHH.0000000000000033.
- CDC. Revised surveillance case definitions for HIV infection among adults, adolescents, and children aged <18 months and for HIV infection and AIDS among children aged 18 months to <13 years—U.S., 2008. MMWR 2008;57(RR-10):1–12.
- CDC [Selik RM, Mokotoff ED, Branson B, Owen SM, Whitmore S, Hall HI]. Revised surveillance case definition for HIV infection—U.S., 2014pdf icon. MMWR 2014;63(RR-03):1–10.
- U.S. Census Bureau. Population and Housing Unit Estimates Datasetsexternal icon. Accessed September 26, 2018.
- U.S. Census Bureau. International Data Baseexternal icon. Updated August 2018. Accessed September 26, 2018.
- Office of Management and Budget. Revisions to the standards for the classification of federal data on race and ethnicityexternal icon. Federal Register 1997;62:58782–58790. Accessed September 26, 2018.
- Harrison KM, Kajese T, Hall HI, Song R. Risk factor redistribution of the national HIV/AIDS surveillance data: an alternative approachexternal icon. Public Health Rep 2008;123(5):618–627.
- Rubin DB. Multiple Imputation for Nonresponse in Surveysexternal icon. New York: John Wiley & Sons Inc; 1987.
- Office of Management and Budget. 2010 Standards for delineating metropolitan and micropolitan statistical areasexternal icon. Federal Register 2010;75(123):37246–39052. Accessed September 26, 2018.
- Office of Management and Budget. Revised delineations of metropolitan statistical areas, new definitions of micropolitan statistical areas and combined statistical areas, and guidance on uses of the delineations of these areasexternal icon. OMB Bulletin 13-01. Published February 28, 2013. Accessed September 26, 2018.
The following were prepared by using HIV surveillance data:
- MMWR articles (selected)
- Other surveillance reports
- Public-use slides updated annually
- NCHHSTP AtlasPlus [interactive tool for accessing HIV/AIDS, STD, TB, and hepatitis data]
CDC. Establishing a holistic framework to reduce inequities in HIV, viral hepatitis, STDs, and tuberculosis in the U.S.. Published October 2010. Accessed September 26, 2018.
CDC. Estimated HIV incidence and prevalence in the U.S., 2010–2016. HIV Surveillance Supplemental Report 2019;24(No. 1). Published February 2019. Accessed February 26, 2020.
CDC. Monitoring selected national HIV prevention and care objectives by using HIV surveillance data—U.S. and 6 dependent areas, 2017. HIV Surveillance Supplemental Report 2019; 24(No. 3). Published June 2019. Accessed February 26, 2020.
CDC [Selik RM, Mokotoff ED, Branson B, Owen SM, Whitmore S, Hall HI]. Revised surveillance case definition for HIV infection—U.S., 2014. MMWR 2014;63(RR-03):1–10.
CDC. Revised surveillance case definitions for HIV infection among adults, adolescents, and children aged <18 months and for HIV infection and AIDS among children aged 18 months to <13 years— U.S., 2008pdf icon. MMWR 2008;57(RR-10):1–12.Accessed September 26, 2018.
CDC [Smith DK, Van Handel M, Wolitski RJ, et al]. Vital Signs: Estimated percentages and numbers of adults with indications for preexposure prophylaxis to prevent HIV acquisition—U.S., 2015. MMWR 2015;64(46):1291–1295. Accessed September 26, 2018.
CDC [Dailey AF, Hoots BE, Hall HI, et al]. Vital Signs: Human immunodeficiency virus testing and diagnosis delays—U.S.. MMWR 2017;66(47):1300–1306. Accessed September 26, 2018.
Cohen SM, Gray KM, Ocfemia MC, Johnson AS, Hall HI. The status of the National HIV Surveillance System, U.S., 2013external icon. Public Health Rep 2014;129(4):335–341. doi:10.1177/003335491412900408.
Frieden TR, Foti KE, Mermin J. Applying public health principles to the HIV epidemic—how are we doing?external icon N Engl J Med 2015;373:2281–2287. doi:10.1056/NEJMms1513641.
Hall HI, Song R, Tang T, et al. HIV trends in the U.S.: diagnoses and estimated incidenceexternal icon. JMIR Public Health Surveill 2017;3(1):e8. doi.10.2196/publichealth.7051.
- Alabama: http://www.alabamapublichealth.gov/hiv/publications.htmlexternal icon
- Alaska: https://dhss.alaska.gov/dph/Epi/hivstd/Pages/hivdata.aspxexternal icon
- Arizona: http://www.azdhs.gov/phs/edc/odis/hiv-epidemiology/reports/index.php?pg=annualexternal icon
- Arkansas: https://www.healthy.arkansas.gov/programs-services/topics/hiv-aids-sti-surveillanceexternal icon
- California: https://www.cdph.ca.gov/Programs/CID/DOA/Pages/OAsre.aspxexternal icon
- Chicago: https://www.cityofchicago.org/city/en/depts/cdph/provdrs/health_data_and_reports/svcs/get_sti_hiv_datainchicago.htmlexternal icon
- Colorado: https://www.colorado.gov/pacific/cdphe/sti-hiv-dataexternal icon
- Connecticut: https://portal.ct.gov/DPH/AIDS–Chronic-Diseases/Surveillance/Connecticut-HIV-Statisticsexternal icon
- Delaware: http://www.dhss.delaware.gov/dhss/dph/epi/disstatshiv.htmlexternal icon
- District of Columbia: https://dchealth.dc.gov/service/hiv-reports-and-publicationsexternal icon
- Florida: http://www.floridahealth.gov/diseases-and-conditions/aids/surveillance/index.htmlexternal icon
- Georgia: https://dph.georgia.gov/data-fact-sheet-summaries#SurveillanceSummariesexternal icon
- Guam: http://dphss.guam.gov/hiv-surveillance-program/external icon
- Hawaii: https://health.hawaii.gov/harmreduction/hiv-aids-surveillance/external icon
- Houston: http://www.houstontx.gov/health/HIV-STD/external icon
- Idaho: http://healthandwelfare.idaho.gov/Health/FamilyPlanningSTDHIV/STDStatistics/tabid/393/Default.aspxexternal icon
- Illinois: http://dph.illinois.gov/topics-services/diseases-and-conditions/hiv-aids/hiv-surveillance/update-reportsexternal icon
- Indiana: http://www.in.gov/isdh/23266.htmexternal icon
- Iowa: http://idph.iowa.gov/hivstdhep/hiv/dataexternal icon
- Kansas: https://www.kdhe.ks.gov/474/Kansas-STI-HIV-Statisticsexternal icon
- Kentucky: https://chfs.ky.gov/agencies/dph/dehp/hab/Pages/reportsstats.aspxexternal icon
- Los Angeles: http://publichealth.lacounty.gov/dhsp/Reports.htmexternal icon
- Louisiana: http://new.dhh.louisiana.gov/index.cfm/newsroom/category/63external icon
- Maine: https://www.maine.gov/dhhs/mecdc/infectious-disease/hiv-std/data/index.shtml external icon
- Maryland: https://health.maryland.gov/phpa/OIDEOR/CHSE/Pages/statistics.aspxexternal icon
- Massachusetts: https://www.mass.gov/lists/hivaids-epidemiologic-profilesexternal icon
- Michigan: https://www.michigan.gov/mdhhs/0,5885,7-339-71550_2955_2982_46000_46003-35962–,00.htmlexternal icon
- Minnesota: https://www.health.state.mn.us/diseases/hiv/stats/index.htmlexternal icon
- Mississippi: https://msdh.ms.gov/msdhsite/_static/14,0,150.htmlexternal icon
- Missouri: http://health.mo.gov/data/hivstdaids/data.phpexternal icon
- Montana: https://dphhs.mt.gov/publichealth/cdepi/surveillanceexternal icon
- Nebraska: http://dpbh.nv.gov/Programs/HIV-OPHIE/dta/Publications/HIV/AIDS_Surveillance_Program_(HIV-OPHIE)_-_Publications/external icon
- Nevada: http://dpbh.nv.gov/Programs/HIV-OPHIE/dta/Publications/HIV/AIDS_Surveillance_Program_(HIV-OPHIE)_-_Publications/external icon
- New Hampshire: http://www.dhhs.nh.gov/data/index.htmexternal icon
- New Jersey: http://www.nj.gov/health/hivstdtb/hiv-aids/statmap.shtmlexternal icon
- New Mexico: http://nmhealth.org/data/infectious/20/external icon
- New York: https://www.health.ny.gov/diseases/aids/general/statistics/index.htmexternal icon
- New York City: http://www1.nyc.gov/site/doh/data/data-sets/hiv-aids-surveillance-and-epidemiology-reports.pageexternal icon
- North Carolina: http://epi.publichealth.nc.gov/cd/stds/figures.htmlexternal icon
- North Dakota: https://www.ndhealth.gov/hiv/Data/external icon
- Ohio: https://odh.ohio.gov/wps/portal/gov/odh/know-our-programs/hiv-aids-surveillance-program/data-and-statisticsexternal icon
- Oklahoma: https://www.ok.gov/health/Prevention_and_Preparedness/HIV_STD_Service/Fact_Sheets_-_OK_Data/external icon
- Oregon: http://public.health.oregon.gov/DiseasesConditions/CommunicableDisease/DiseaseSurveillanceData/HIVData/Pages/index.aspxexternal icon
- Pennsylvania: https://www.health.pa.gov/topics/programs/HIV/Pages/Annual-Summary.aspxexternal icon
- Philadelphia: http://www.phila.gov/health/AACO/AACODataResearch.htmlexternal icon
- Puerto Rico: https://www.salud.gov.pr/CMS/61external icon
- Rhode Island: http://health.ri.gov/publications/bytopic.php?parm=HIVexternal icon
- San Francisco: http://www.sfdph.org/dph/files/reports/default.aspexternal icon
- South Carolina: http://www.dhec.sc.gov/Health/DiseasesandConditions/InfectiousDiseases/HIVandSTDs/DataandReports/external icon
- South Dakota: http://doh.sd.gov/diseases/infectious/HIV-AIDS/Prevention.aspxexternal icon
- Tennessee: https://www.tn.gov/health/health-program-areas/statistics/health-data/hiv-data.htmlexternal icon
- Texas: http://www.dshs.state.tx.us/hivstd/reports/default.shtmexternal icon
- U.S. Virgin Islands: https://doh.vi.gov/programs/communicable-diseasesexternal icon
- Utah: http://health.utah.gov/epi/diseases/hivaids/surveillance/index.htmlexternal icon
- Vermont: http://www.healthvermont.gov/immunizations-infectious-disease/hiv/surveillanceexternal icon
- Virginia: http://www.vdh.virginia.gov/disease-prevention/disease-prevention/hiv-aids-sexually-transmitted-disease-std-hepatitis-reports/external icon
- Washington: https://doh.wa.gov/data-statistical-reports/diseases-and-chronic-conditions/hiv-dataexternal icon
- West Virginia: https://oeps.wv.gov/hiv-aids/Pages/hiv-aids_data.aspxexternal icon
- Wisconsin: http://dhs.wisconsin.gov/aids-hiv/Stats/index.htmexternal icon
- Wyoming: https://health.wyo.gov/publichealth/communicable-disease-unit/hivaids-surveillance-program/external icon
Note: Electronic reports are not available for the following areas: American Samoa, the Northern Mariana Islands, and the Republic of Palau.
Ending the HIV Epidemic: A Plan for America Initiative, Phase I Areas
To accelerate action to end the HIV epidemic, the U.S. Department of Health and Human Services (HHS) has proposed a plan to reduce new HIV infections in the United States. The Ending the HIV Epidemic: A Plan for America (EHE) initiative, Phase I, will implement high-impact HIV prevention, care, treatment, and outbreak response strategies in 48 counties, the District of Columbia, San Juan, Puerto Rico, and 7 states with a substantial rural HIV burden. The goal of the initiative is to reduce new HIV infections by 75% in 5 years, and by 90% in 10 years.
The EHE Phase I jurisdictions include the District of Columbia, San Juan, Puerto Rico, and 48 counties: Arizona—Maricopa County; California—Alameda County, Los Angeles County, Orange County, Riverside County, Sacramento County, San Bernardino County, San Diego County, San Francisco County; Florida—Broward County, Duval County, Hillsborough County, Miami-Dade County, Orange County, Palm Beach County, Pinellas County; Georgia—Cobb County, DeKalb County, Fulton County, Gwinnett County; Illinois—Cook County; Indiana—Marion County; Louisiana—East Baton Rouge Parish, Orleans Parish; Maryland—Baltimore City, Montgomery County, Prince George’s County; Massachusetts—Suffolk County; Michigan—Wayne County; Nevada—Clark County; New Jersey—Essex County, Hudson County; New York—Bronx County, Kings County, New York County, Queens County; North Carolina—Mecklenburg County; Ohio—Cuyahoga County, Franklin County, Hamilton County; Pennsylvania—Philadelphia County; Tennessee—Shelby County; Texas—Bexar County, Dallas County, Harris County, Tarrant County, Travis County; Washington—King County.
EHE Phase I jurisdictions also include the following 7 states with substantial rural HIV burden: Alabama, Arkansas, Kentucky, Mississippi, Missouri, Oklahoma, and South Carolina.
| 2017 | 2018 | |||||||
|---|---|---|---|---|---|---|---|---|
| Adults and adolescents | Total | Adults and adolescents | Total | |||||
| Area of residence | No. | Ratea | No. | Ratea | No. | Ratea | No. | Ratea |
| Arizona | ||||||||
| Maricopa County | 494 | 13.8 | 495 | 11.4 | 535 | 14.6 | 540 | 12.2 |
| California | ||||||||
| Alameda County | 204 | 14.5 | 204 | 12.3 | 198 | 14.0 | 198 | 11.9 |
| Los Angeles County | 1,799 | 21.1 | 1,800 | 17.8 | 1,690 | 19.8 | 1,693 | 16.8 |
| Orange County | 312 | 11.6 | 312 | 9.8 | 286 | 10.6 | 286 | 9.0 |
| Riverside County | 273 | 13.8 | 275 | 11.4 | 257 | 12.8 | 258 | 10.5 |
| Sacramento County | 170 | 13.4 | 171 | 11.2 | 156 | 12.2 | 156 | 10.1 |
| San Bernardino County | 253 | 14.5 | 253 | 11.7 | 274 | 15.6 | 274 | 12.6 |
| San Diego County | 414 | 14.8 | 415 | 12.5 | 378 | 13.4 | 378 | 11.3 |
| San Francisco County | 244 | 30.9 | 244 | 27.8 | 237 | 29.9 | 237 | 26.8 |
| District of Columbia | 313 | 52.4 | 315 | 45.3 | 275 | 45.7 | 275 | 39.1 |
| Florida | ||||||||
| Broward County | 671 | 40.9 | 673 | 34.8 | 626 | 37.8 | 627 | 32.1 |
| Duval County | 300 | 38.4 | 301 | 32.1 | 274 | 34.6 | 277 | 29.2 |
| Hillsborough County | 300 | 25.5 | 301 | 21.3 | 301 | 25.0 | 301 | 20.9 |
| Miami-Dade County | 1,141 | 48.7 | 1,143 | 41.6 | 1,177 | 49.9 | 1,178 | 42.7 |
| Orange County | 461 | 40.6 | 462 | 34.1 | 464 | 40.0 | 467 | 33.8 |
| Palm Beach County | 289 | 22.8 | 291 | 19.8 | 284 | 22.1 | 284 | 19.1 |
| Pinellas County | 164 | 19.2 | 165 | 17.0 | 175 | 20.3 | 175 | 17.9 |
| Georgia | ||||||||
| Cobb County | 153 | 24.5 | 153 | 20.3 | 153 | 24.3 | 154 | 20.3 |
| DeKalb County | 364 | 58.5 | 364 | 48.4 | 362 | 57.8 | 362 | 47.8 |
| Fulton County | 618 | 70.7 | 618 | 59.5 | 605 | 68.3 | 605 | 57.6 |
| Gwinnett County | 173 | 23.3 | 173 | 18.8 | 151 | 20.0 | 151 | 16.3 |
| Illinois | ||||||||
| Cook County | 978 | 22.3 | 984 | 18.9 | 970 | 22.2 | 974 | 18.8 |
| Indiana | ||||||||
| Marion County | 226 | 29.1 | 227 | 23.9 | 205 | 26.2 | 207 | 21.7 |
| Louisiana | ||||||||
| East Baton Rouge Parish | 166 | 44.9 | 166 | 37.4 | 178 | 48.4 | 178 | 40.4 |
| Orleans Parish | 186 | 55.8 | 186 | 47.5 | 179 | 53.7 | 179 | 45.8 |
| Maryland | ||||||||
| Baltimore City | 238 | 46.2 | 238 | 39.0 | 231 | 45.3 | 232 | 38.5 |
| Montgomery County | 162 | 18.6 | 163 | 15.5 | 126 | 14.4 | 126 | 12.0 |
| Prince George’s County | 309 | 40.7 | 309 | 34.0 | 308 | 40.5 | 308 | 33.9 |
| Massachusetts | ||||||||
| Suffolk County | 159 | 22.6 | 159 | 19.8 | 147 | 20.7 | 148 | 18.3 |
| Michigan | ||||||||
| Wayne County | 325 | 22.3 | 326 | 18.6 | 300 | 20.6 | 301 | 17.2 |
| Nevada | ||||||||
| Clark County | 444 | 24.5 | 445 | 20.4 | 450 | 24.2 | 451 | 20.2 |
| New Jersey | ||||||||
| Essex County | 313 | 47.5 | 315 | 39.6 | 263 | 39.7 | 264 | 33.0 |
| Hudson County | 164 | 28.9 | 164 | 24.4 | 161 | 28.2 | 162 | 24.0 |
| New York | ||||||||
| Bronx County | 506 | 43.0 | 506 | 35.1 | 447 | 38.1 | 448 | 31.3 |
| Kings County | 630 | 29.3 | 630 | 24.3 | 548 | 25.6 | 549 | 21.3 |
| New York County | 396 | 27.3 | 397 | 24.4 | 371 | 25.5 | 371 | 22.8 |
| Queens County | 431 | 22.1 | 431 | 18.8 | 411 | 21.2 | 411 | 18.0 |
| North Carolina | ||||||||
| Mecklenburg County | 269 | 30.2 | 269 | 25.0 | 242 | 26.7 | 243 | 22.2 |
| Ohio | ||||||||
| Cuyahoga County | 148 | 13.9 | 149 | 11.9 | 149 | 14.1 | 149 | 12.0 |
| Franklin County | 222 | 20.7 | 222 | 17.1 | 194 | 17.9 | 197 | 15.0 |
| Hamilton County | 187 | 27.6 | 187 | 23.0 | 184 | 27.0 | 184 | 22.5 |
| Pennsylvania | ||||||||
| Philadelphia County | 498 | 37.6 | 498 | 31.5 | 442 | 33.3 | 442 | 27.9 |
| Puerto Rico | ||||||||
| San Juan Municipio | 110 | 37.3 | 110 | 32.7 | 104 | 36.7 | 104 | 32.4 |
| Tennessee | ||||||||
| Shelby County | 259 | 33.8 | 259 | 27.7 | 303 | 39.6 | 306 | 32.7 |
| Texas | ||||||||
| Bexar County | 348 | 21.8 | 349 | 17.8 | 325 | 20.1 | 327 | 16.5 |
| Dallas County | 815 | 38.5 | 817 | 31.1 | 785 | 36.8 | 785 | 29.8 |
| Harris County | 1,100 | 29.3 | 1,101 | 23.6 | 1,199 | 31.7 | 1,200 | 25.5 |
| Tarrant County | 303 | 18.2 | 303 | 14.7 | 275 | 16.3 | 275 | 13.2 |
| Travis County | 210 | 20.4 | 210 | 17.1 | 189 | 18.0 | 190 | 15.2 |
| Washington | ||||||||
| King County | 210 | 11.2 | 211 | 9.6 | 292 | 15.4 | 294 | 13.2 |
Note: Data are based on address of residence at time of diagnosis of HIV infection.
aRates are per 100,000 population.
| American Indian/ Alaska Native | Asiana | Black/ African American | Hispanic/ Latinob | Native Hawaiian/ other Pacific Islander | White | Multiple races | Totalc | |||||||||
|---|---|---|---|---|---|---|---|---|---|---|---|---|---|---|---|---|
| Area of residence | No. | Rated | No. | Rated | No. | Rated | No. | Rated | No. | Rated | No. | Rated | No. | Rated | No. | Rated |
| Arizona | ||||||||||||||||
| Maricopa County | 286 | 488.0 | 163 | 100.4 | 1,730 | 889.2 | 3,356 | 321.0 | 15 | 210.4 | 5,424 | 255.1 | 346 | 545.4 | 11,352 | 310.3 |
| California | ||||||||||||||||
| Alameda County | 12 | 338.0 | 391 | 87.4 | 2,296 | 1,545.9 | 1,279 | 434.2 | 26 | 227.4 | 1,787 | 385.4 | 263 | 545.1 | 6,055 | 427.3 |
| Los Angeles County | 55 | 326.5 | 1,693 | 128.0 | 9,538 | 1,368.8 | 22,839 | 579.0 | 48 | 247.2 | 13,058 | 550.3 | 2,215 | 1,428.6 | 49,449 | 579.8 |
| Orange County | 7 | 125.2 | 500 | 86.5 | 376 | 832.2 | 3,358 | 392.9 | 9 | 118.6 | 2,455 | 215.5 | 174 | 291.6 | 6,879 | 255.7 |
| Riverside County | 21 | 213.1 | 137 | 99.1 | 769 | 601.8 | 2,342 | 248.7 | 5 | 85.2 | 5,452 | 725.4 | 295 | 762.8 | 9,021 | 448.0 |
| Sacramento County | 19 | 285.2 | 153 | 72.3 | 1,058 | 850.2 | 907 | 328.6 | 18 | 123.8 | 1,963 | 329.5 | 167 | 337.4 | 4,285 | 335.2 |
| San Bernardino County | 17 | 235.7 | 100 | 74.8 | 958 | 660.6 | 2,123 | 233.8 | 5 | 93.7 | 1,121 | 211.8 | 138 | 440.1 | 4,462 | 253.6 |
| San Diego County | 37 | 300.7 | 409 | 116.7 | 1,616 | 1,209.1 | 4,972 | 557.6 | 21 | 174.3 | 5,673 | 423.9 | 403 | 522.5 | 13,131 | 466.4 |
| San Francisco County | 36 | 2,262.1 | 807 | 282.2 | 1,516 | 3,815.4 | 2,756 | 2,433.7 | 28 | 970.4 | 6,499 | 1,984.8 | 507 | 2,248.5 | 12,149 | 1,531.2 |
| District of Columbia | 13 | 1,035.0 | 71 | 257.3 | 9,969 | 3,781.9 | 1,177 | 1,917.2 | 5 | 1,689.2 | 2,191 | 929.9 | 763 | 6,649.2 | 14,194 | 2,360.8 |
| Florida | ||||||||||||||||
| Broward County | 13 | 401.5 | 119 | 188.8 | 9,103 | 2,026.9 | 3,748 | 759.5 | 7 | 640.5 | 5,940 | 953.6 | 553 | 2,512.8 | 19,483 | 1,177.3 |
| Duval County | 3 | 113.5 | 44 | 109.5 | 4,124 | 1,843.8 | 379 | 506.6 | 3 | 439.1 | 1,345 | 310.0 | 181 | 1,214.1 | 6,079 | 768.7 |
| Hillsborough County | 2 | 69.4 | 45 | 85.5 | 3,035 | 1,647.0 | 1,556 | 461.3 | 2 | 239.1 | 2,043 | 337.2 | 171 | 905.5 | 6,854 | 569.9 |
| Miami-Dade County | 6 | 298.5 | 74 | 195.3 | 10,874 | 3,067.3 | 12,402 | 754.7 | 7 | 1,287.5 | 2,575 | 843.6 | 378 | 2,679.2 | 26,316 | 1,116.3 |
| Orange County | 7 | 274.5 | 58 | 87.2 | 3,670 | 1,622.2 | 2,291 | 630.5 | 12 | 888.5 | 2,371 | 491.6 | 208 | 1,180.6 | 8,617 | 742.9 |
| Palm Beach County | 3 | 143.0 | 35 | 95.8 | 4,712 | 2,101.4 | 1,242 | 453.1 | 3 | 535.6 | 1,748 | 238.2 | 174 | 1,283.8 | 7,917 | 616.2 |
| Pinellas County | 1 | 49.0 | 44 | 146.9 | 1,376 | 1,656.1 | 501 | 634.9 | 0 | 0.0 | 2,408 | 366.9 | 130 | 1,066.4 | 4,460 | 516.7 |
| Georgia | ||||||||||||||||
| Cobb County | 0 | 0.0 | 13 | 37.1 | 1,906 | 1,111.7 | 341 | 466.0 | 1 | 396.0 | 698 | 206.1 | 194 | 1,820.1 | 3,153 | 500.2 |
| DeKalb County | 3 | 305.9 | 67 | 165.7 | 6,128 | 1,811.4 | 632 | 1,409.7 | 3 | 1,455.6 | 1,176 | 609.9 | 427 | 4,708.6 | 8,437 | 1,346.4 |
| Fulton County | 7 | 578.2 | 46 | 69.0 | 10,812 | 2,855.1 | 935 | 1,623.9 | 4 | 2,493.6 | 2,562 | 695.8 | 760 | 5,617.9 | 15,127 | 1,707.2 |
| Gwinnett County | 0 | 0.0 | 53 | 55.0 | 1,655 | 803.0 | 499 | 341.0 | 2 | 613.7 | 503 | 173.2 | 151 | 1,180.0 | 2,863 | 380.0 |
| Illinois | ||||||||||||||||
| Cook County | 28 | 541.9 | 332 | 96.0 | 12,615 | 1,261.3 | 5,496 | 530.7 | 11 | 1,318.4 | 5,326 | 276.8 | 1,389 | 2,631.2 | 25,198 | 577.4 |
| Indiana | ||||||||||||||||
| Marion County | 3 | 195.1 | 136 | 500.8 | 2,283 | 1,069.6 | 446 | 635.3 | 0 | 0.0 | 1,630 | 359.4 | 193 | 1,295.1 | 4,691 | 600.6 |
| Louisiana | ||||||||||||||||
| East Baton Rouge Parish | 4 | 502.2 | 8 | 64.8 | 3,389 | 2,050.9 | 73 | 540.8 | 0 | 0.0 | 419 | 243.2 | 39 | 1,048.9 | 3,932 | 1,068.6 |
| Orleans Parish | 3 | 387.4 | 19 | 188.0 | 3,352 | 1,735.7 | 270 | 1,558.8 | 0 | 0.0 | 1,169 | 1,080.1 | 113 | 3,050.9 | 4,928 | 1,478.3 |
| Maryland | ||||||||||||||||
| Baltimore City | 9 | 614.1 | 21 | 144.2 | 7,787 | 2,489.4 | 354 | 1,514.0 | 0 | 0.0 | 775 | 514.8 | 495 | 6,604.7 | 9,441 | 1,849.7 |
| Montgomery County | 3 | 201.1 | 77 | 55.3 | 2,122 | 1,332.5 | 566 | 356.0 | 1 | 229.8 | 562 | 140.8 | 257 | 1,381.7 | 3,588 | 409.0 |
| Prince George’s County | 4 | 206.0 | 35 | 100.9 | 4,584 | 952.6 | 508 | 401.6 | 0 | 0.0 | 265 | 259.3 | 425 | 3,319.9 | 5,821 | 766.3 |
| Massachusetts | ||||||||||||||||
| Suffolk County | 5 | 379.7 | 123 | 183.1 | 2,199 | 1,571.1 | 1,466 | 962.2 | 3 | 715.2 | 1,842 | 550.0 | 102 | 825.6 | 5,740 | 810.2 |
| Michigan | ||||||||||||||||
| Wayne County | 8 | 156.7 | 25 | 48.6 | 5,236 | 956.0 | 293 | 372.1 | 0 | 0.0 | 966 | 129.4 | 209 | 763.9 | 6,737 | 462.4 |
| Nevada | ||||||||||||||||
| Clark County | 35 | 399.9 | 310 | 157.6 | 2,402 | 1,138.4 | 2,370 | 439.4 | 37 | 286.0 | 3,146 | 377.1 | 300 | 551.6 | 8,600 | 463.0 |
| New Jersey | ||||||||||||||||
| Essex County | 1 | 76.4 | 28 | 74.0 | 6,159 | 2,398.5 | 1,775 | 1,211.9 | 3 | 1,168.0 | 495 | 233.2 | 635 | 8,071.7 | 9,114 | 1,375.2 |
| Hudson County | 3 | 361.3 | 86 | 91.3 | 1,399 | 2,311.5 | 2,177 | 917.0 | 0 | 0.0 | 886 | 517.2 | 326 | 5,214.4 | 4,884 | 855.6 |
| New York | ||||||||||||||||
| Bronx County | 9 | 282.5 | 99 | 204.7 | 11,587 | 3,320.8 | 13,660 | 2,117.8 | 1 | 162.7 | 894 | 772.1 | 1,333 | 13,127.9 | 27,625 | 2,357.0 |
| Kings County | 7 | 174.2 | 354 | 130.3 | 14,522 | 2,211.4 | 7,110 | 1,792.8 | 4 | 630.6 | 2,788 | 357.8 | 1,707 | 5,234.7 | 26,524 | 1,238.6 |
| New York County | 10 | 486.8 | 557 | 299.0 | 7,434 | 4,160.4 | 9,085 | 2,527.6 | 8 | 1,393.3 | 8,340 | 1,189.0 | 1,601 | 6,759.0 | 27,156 | 1,870.1 |
| Queens County | 12 | 178.7 | 732 | 140.6 | 5,085 | 1,443.3 | 6,807 | 1,310.2 | 7 | 296.5 | 2,023 | 401.1 | 1,203 | 3,593.2 | 15,901 | 819.8 |
| North Carolina | ||||||||||||||||
| Mecklenburg County | 8 | 292.8 | 45 | 80.5 | 4,030 | 1,420.1 | 496 | 461.3 | 1 | 242.7 | 985 | 222.7 | 308 | 2,196.6 | 5,876 | 648.0 |
| Ohio | ||||||||||||||||
| Cuyahoga County | 2 | 123.8 | 19 | 54.2 | 2,662 | 882.5 | 541 | 910.2 | 0 | 0.0 | 1,233 | 190.9 | 234 | 1,483.4 | 4,717 | 445.2 |
| Franklin County | 6 | 282.6 | 35 | 56.6 | 2,089 | 889.5 | 293 | 559.1 | 1 | 225.6 | 2,141 | 302.5 | 247 | 1,026.5 | 4,833 | 446.0 |
| Hamilton County | 0 | 0.0 | 17 | 86.7 | 1,725 | 1,014.1 | 100 | 530.7 | 0 | 0.0 | 971 | 211.7 | 122 | 1,070.4 | 2,943 | 432.7 |
| Pennsylvania | ||||||||||||||||
| Philadelphia County | 28 | 978.5 | 163 | 156.7 | 10,841 | 2,046.2 | 2,710 | 1,499.9 | 5 | 1,460.2 | 2,660 | 544.8 | 509 | 2,365.1 | 16,917 | 1,274.3 |
| Puerto Ricoe | ||||||||||||||||
| San Juan Municipio | 0 | — | 0 | — | 2 | — | 3,244 | — | 0 | — | 8 | — | 0 | — | 3,254 | 1,148.3 |
| Tennessee | ||||||||||||||||
| Shelby County | 2 | 153.9 | 10 | 47.7 | 5,170 | 1,277.7 | 187 | 462.9 | 1 | 756.8 | 597 | 205.8 | 253 | 3,132.5 | 6,221 | 812.6 |
| Texas | ||||||||||||||||
| Bexar County | 2 | 51.6 | 48 | 95.2 | 915 | 754.7 | 4,011 | 421.7 | 2 | 96.8 | 1,068 | 227.0 | 262 | 1,362.7 | 6,308 | 389.8 |
| Dallas County | 6 | 93.3 | 199 | 137.1 | 7,632 | 1,565.7 | 4,687 | 585.7 | 6 | 620.0 | 4,659 | 694.6 | 937 | 3,871.1 | 18,126 | 848.9 |
| Harris County | 8 | 106.6 | 339 | 116.6 | 12,290 | 1,715.1 | 7,861 | 508.0 | 2 | 98.6 | 4,190 | 355.2 | 978 | 2,303.1 | 25,670 | 677.9 |
| Tarrant County | 4 | 61.0 | 95 | 95.6 | 2,508 | 900.5 | 1,296 | 284.9 | 5 | 156.7 | 1,519 | 184.5 | 300 | 1,166.1 | 5,727 | 338.6 |
| Travis County | 1 | 36.6 | 68 | 89.1 | 1,062 | 1,258.8 | 1,773 | 537.0 | 1 | 138.3 | 1,816 | 336.9 | 210 | 1,237.9 | 4,931 | 469.5 |
| Washington | ||||||||||||||||
| King County | 41 | 361.5 | 284 | 77.6 | 1,355 | 1,139.5 | 1,050 | 638.8 | 24 | 168.4 | 3,643 | 314.5 | 502 | 744.7 | 6,899 | 363.0 |
Note: Data for the year 2018 are preliminary and based on deaths reported to the Centers for Disease Control and Prevention through December 2019. Data are based on address of residence at the end of the specified year (i.e., most recent known address). Numbers less than 12, and rates based on these numbers, should be interpreted with caution.
aIncludes Asian/Pacific Islander legacy cases (see Technical Notes).
bHispanics/Latinos can be of any race.
cIncludes persons whose race/ethnicity is unknown.
dRates are per 100,000 population.
eRates by race/ethnicity are not provided because U.S. census information is limited for Puerto Rico.