


Key points
Map details
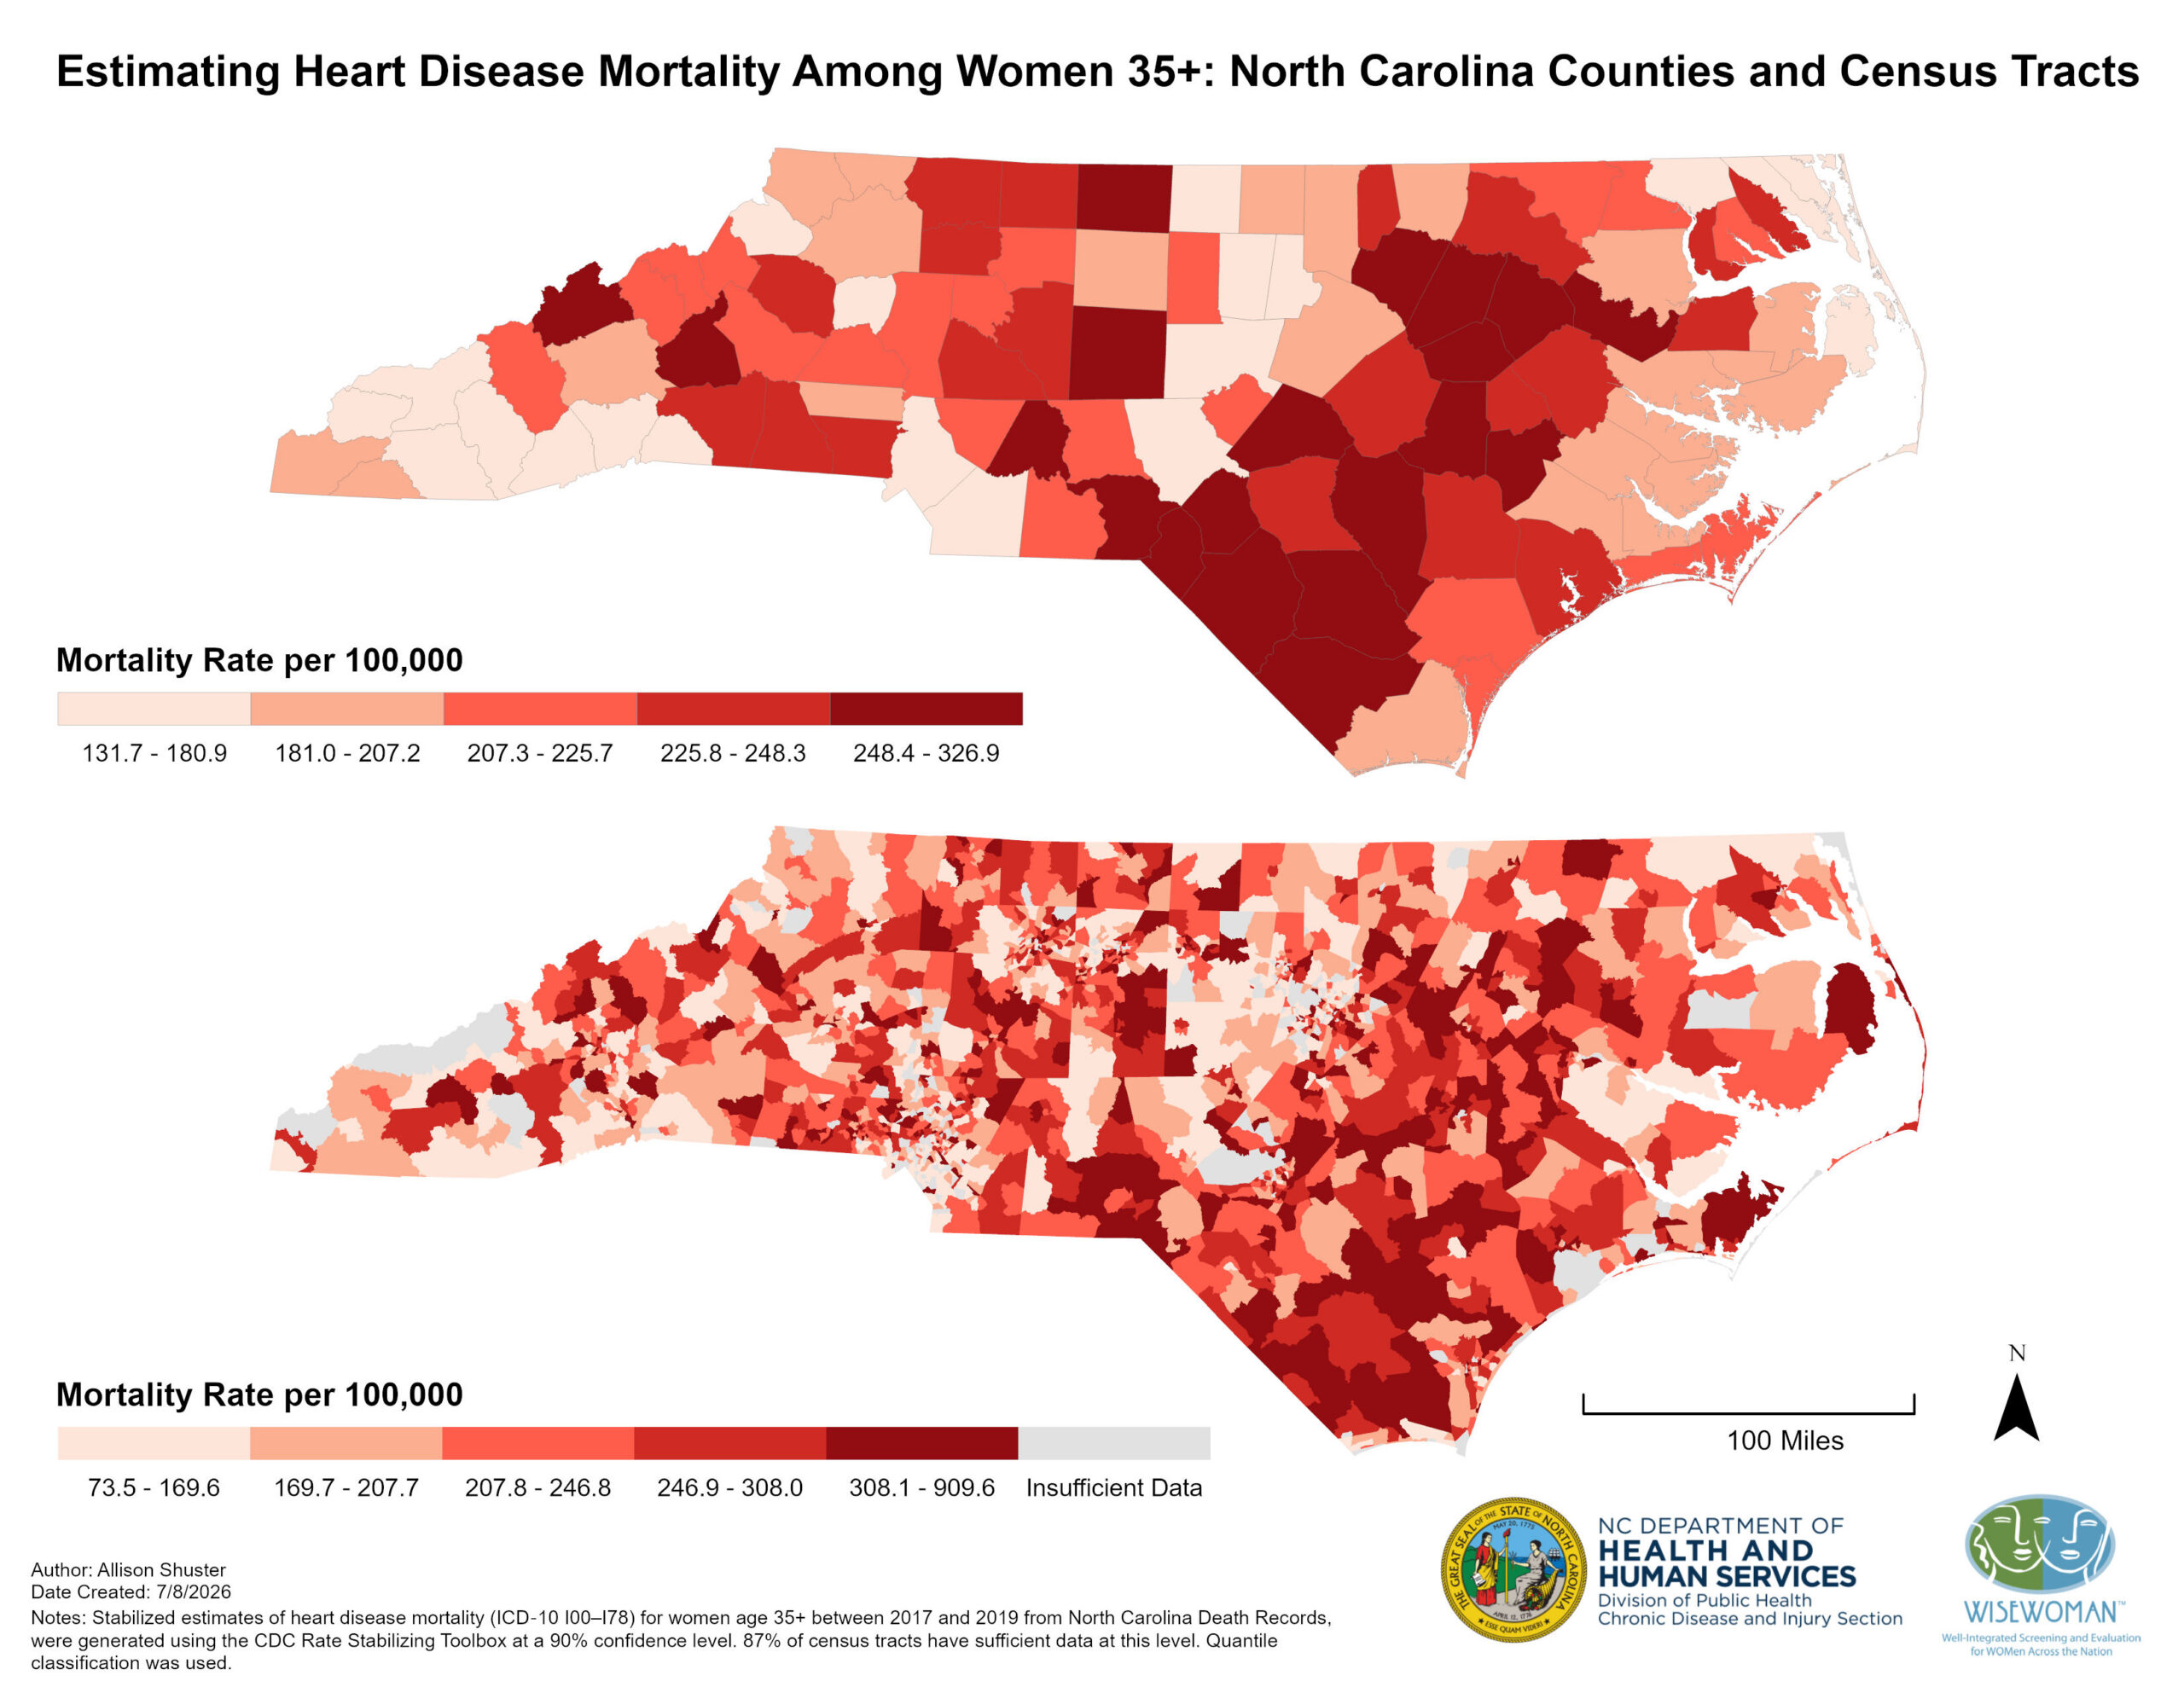
This map displays county- and census-tract-level death rates for heart disease (ICD-10 I00-I78) among women ages 35 and older in North Carolina for 2017-2019. The highest county-level mortality rates (248.4-326.9 per 100,000) are located primarily in the Southeast region of the state, whereas Western North Carolina contains many counties with the lowest mortality rates (131.7-180.9 per 100,000). Census tracts with the highest mortality rates (308.1-909.6 per 100,000) are distributed statewide, showing that pockets of high burden exist even within counties that have overall lower mortality rates.
ArcGIS Pro
Vital statistics
Heart disease mortality was estimated using CDC's Rate Stabilizing Toolbox, applying a 90% confidence level to county and census-tract death records for women 35 and older coded with ICD-10 I00-I78. Stabilized rates were produced for 2017-2019, with 100% of counties and 87% of census tracts meeting data sufficiency requirements. Mortality estimates were grouped into quintiles to support geographic comparison of relative burden across counties and tracts.
This map will be used to help identify communities across North Carolina where heart disease mortality among women 35 and older is most concentrated. It supports targeting and tailoring cardiovascular disease prevention strategies at both county and census-tract levels, ensuring interventions are directed to areas with the greatest burden. The map can also guide resource allocation, inform community partnerships, and strengthen efforts to reduce geographic disparities in heart disease mortality.
Allison Shuster, Data and Evaluation Specialist, NC WISEWOMAN
North Carolina Division of Public Health
allison.shuster@dhhs.nc.gov
Allison Shuster, North Carolina Division of Public Health. Accessed from the Centers for Disease Control and Prevention’s Chronic Disease GIS Map Gallery.
This page was last updated on this date. Updates may include minor edits, image changes, or other modifications to page content.
The information on this page was last reviewed by subject matter experts to ensure accuracy.