


Key points
Map
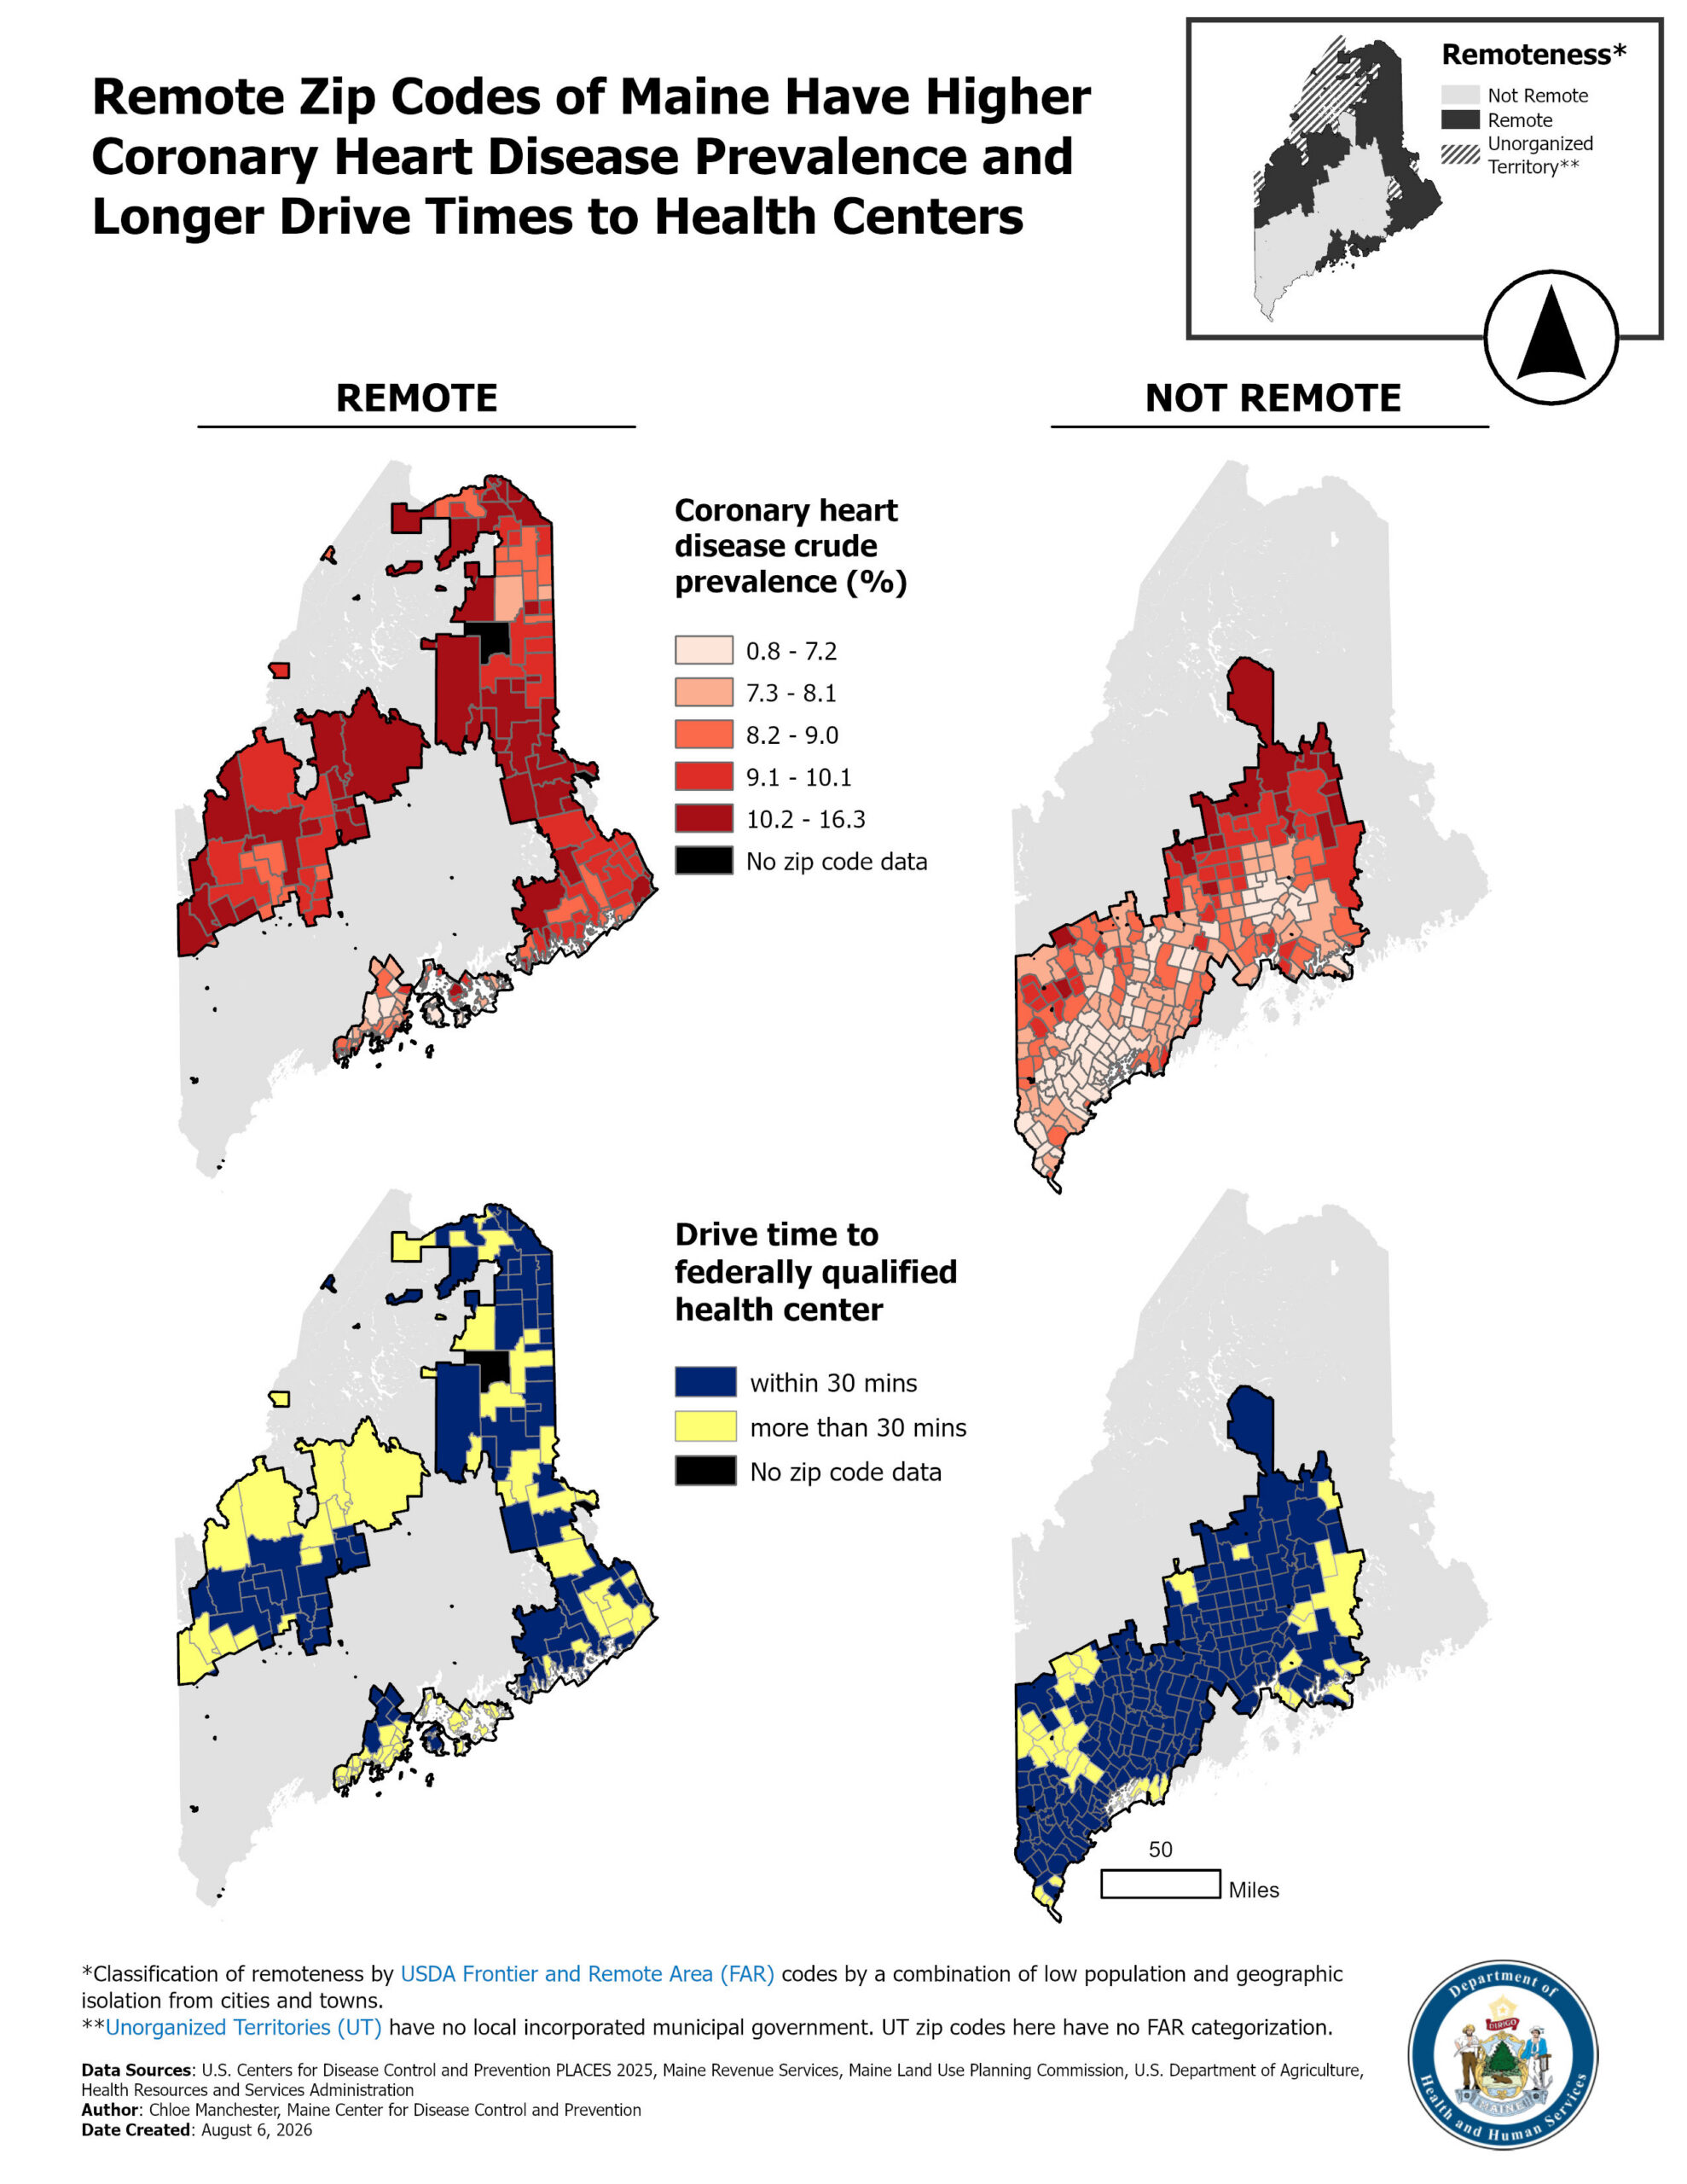
Map details
In this project there are three sets of maps. First, a reference map displays Frontier and Remote Area (FAR) categorization for zip-code tabulation areas (ZCTA) in the state of Maine. This map illustrates that the large majority of the areas categorized as remote are in the lower east portion of Maine and in the northwest of the state along the border with Canada. Additional remote areas are on Maine's islands however these make up a small land area and population. The rural and urban areas are in the southern and central portion of the state. Two additional maps show coronary heart disease crude prevalence side by side for non-remote areas and remote ZCTAs.
Coronary heart disease is displayed in 5 quantiles ranging from 0.8-16.3 percent. In the remote map series there are more ZCTAs in the top two quantiles of coronary heart disease prevalence (10.0-16.3) compared to the areas that are not remote. The subsequent maps show drive time to Federally Qualified Health Centers (FQHC) in terms of 'within 30 minutes' or 'more than 30 minutes.' In the remote map there are more ZCTAs that are in the 'more than 30 minutes' category compared to the map of non-remote areas.
ArcGIS Pro 3.6.2
- BRFSS/PLACES
- Health care locations
- U.S. Census
- USDA Frontier and Remote areas
- Maine Census
- Maine Revenue Services
- Maine Land Use Planning Commission
- Health Resources and Services Administration
This project consists of three sets of choropleth maps. The first set used ZCTA-level data on Frontier and Remote (FAR) classification based on criteria from the USDA Economic Research Service. FAR status was represented as a binary category: FAR (levels 1–4, classified as Frontier or Remote) or non-FAR (level 0, classified as rural or urban). Some areas of Maine do not have an associated ZCTA, often because they are designated as Unorganized Territories, and therefore do not receive an FAR classification. A separate layer was added identifying areas without a ZCTA so that these areas could be excluded from the mapped area of interest. Two additional small-multiple choropleth maps were created showing coronary heart disease crude prevalence at the ZCTA level using data from PLACES: one for non-FAR ZCTAs and one for FAR ZCTAs. Both maps used the same quantile classification breaks, based on the distribution of the full FAR/non-FAR mapping dataset, to allow direct comparison of prevalence across the two groups. Finally, a second series of small-multiple choropleth maps were created showing drive time to the nearest federally qualified health center (FQHC).
First, a network-based service-area analysis was conducted in ArcGIS to generate one-way drive-time polygons at 30-minute intervals from the previously geocoded FQHC locations obtained from HRSA. To represent drive time at the ZCTA level rather than map the service-area polygons themselves, a Point to Feature analysis was used to generate a population-weighted centroid for each ZCTA using ZCTA-level Census population data. ZCTA centroids intersecting each 30-minute service-area polygon were then identified and assigned the corresponding drive-time category. This process was used to generate ZCTA-level drive-time maps for comparison across FAR and non-FAR areas.
This map will help program managers and epidemiologists understand areas of the state with highest levels of coronary heart disease and begin to understand how this negative health outcome may be impacted by barriers to access and remoteness.
Zip codes with elevated crude prevalence of coronary heart disease may be areas where programs can collaborate with community partners to implement targeted interventions. Additionally, the trends highlighted in this map suggest a need to better understand what other variables are driving increased prevalence of coronary heart disease in remote areas, other than greater distance to a health center.
Chloe Manchester, Chronic Disease Epidemiologist
Maine Center for Disease Control and Prevention
(207) 592-0586
chloe.manchester@maine.gov
Chloe Manchester, Maine Center for Disease Control and Prevention. Accessed from the Centers for Disease Control and Prevention’s Chronic Disease GIS Map Gallery. https://www.cdc.gov/heart-disease-and-stroke-data/data-vis/me-chd-prevalence.html
This page was last updated on this date. Updates may include minor edits, image changes, or other modifications to page content.
The information on this page was last reviewed by subject matter experts to ensure accuracy.