What to know
Highlights
In 2024, public health professionals nationwide continued to investigate and respond to infectious disease threats, including H5N1 avian influenza and measles. Some FoodCORE staff stepped away from their enteric work to provide support.
When emergencies like these arise, it is critical for health agencies to have a consistent mechanism for receiving financial and technical support. FoodCORE centers receive funds through the Epidemiology and Laboratory Capacity (ELC) cooperative agreement to improve enteric disease surveillance and outbreak response.
While FoodCORE funding in 2024 was comparable to previous years, the costs of supporting personnel, purchasing supplies and equipment, and maintaining offices and laboratories continued to increase. This further strained an already overextended workforce as they experienced other funding and personnel losses and planned for future resource limitations.
Public health professionals began discussing best practices for maximizing resources and prioritizing investigations and activities; however, targeted investments to improve outbreak response that reflect the rising costs of maintaining capacity at state and local health agencies are still greatly needed. Without additional support, the improvements demonstrated by FoodCORE centers in the early years of the program may be at risk.
FoodCORE activities
To date, four FoodCORE model practices have been published that share the cumulative success of FoodCORE centers so that others can learn from their experiences. In 2024, FoodCORE centers began their revisions to the Student Interview Teams model practice to reflect changes in technologies and processes since it was first published in 2014.
Each year, FoodCORE staff at CDC and in FoodCORE centers share progress and updates on their activities at national meetings and conferences, including the Council of State and Territorial Epidemiologists (CSTE) annual conference and the Integrated Foodborne Outbreak Response and Management (InFORM) conference. In 2024, FoodCORE staff attended the CSTE annual conference in Pittsburgh, PA, and InFORM national conference in Washington, DC.
Program performance
Centers report metrics once a year to document changes resulting from targeted FoodCORE resources. Metrics for Salmonella, Shiga toxin-producing E. coli, and Listeria (SSL) have been collected since late 2010. Metrics for norovirus, other etiologies, and unknown etiology (NOU) investigations have been collected since 2012. The metrics collected by FoodCORE centers are revised as needed to best meet program goals.
Graphs for selected metrics - Year 14
Figure 1
The continued expansion of culture-independent diagnostic tests (CIDTs) without reflex culture in clinical laboratories has placed a great burden of isolate recovery on public health laboratories (PHLs).
Since Year 9, the mean proportion of Salmonella, Shiga toxin-producing E. coli (STEC), Shigella, and Campylobacter preliminary positive clinical specimens or samples received at the PHL that yielded isolates have decreased, while the mean turnaround time to recover isolates has increased.

Figure 2
The mean number of laboratory-confirmed Salmonella and Shigella cases reported to epidemiology staff have surpassed pre-COVID (Y9/2019) levels, yet epidemiology staff continue to maintain quick turnaround timesA to attempt an interview.
Increased investment in the public health workforce is necessary to maintain these improvements in outbreak response activities as the burden of laboratory confirmed cases increases.
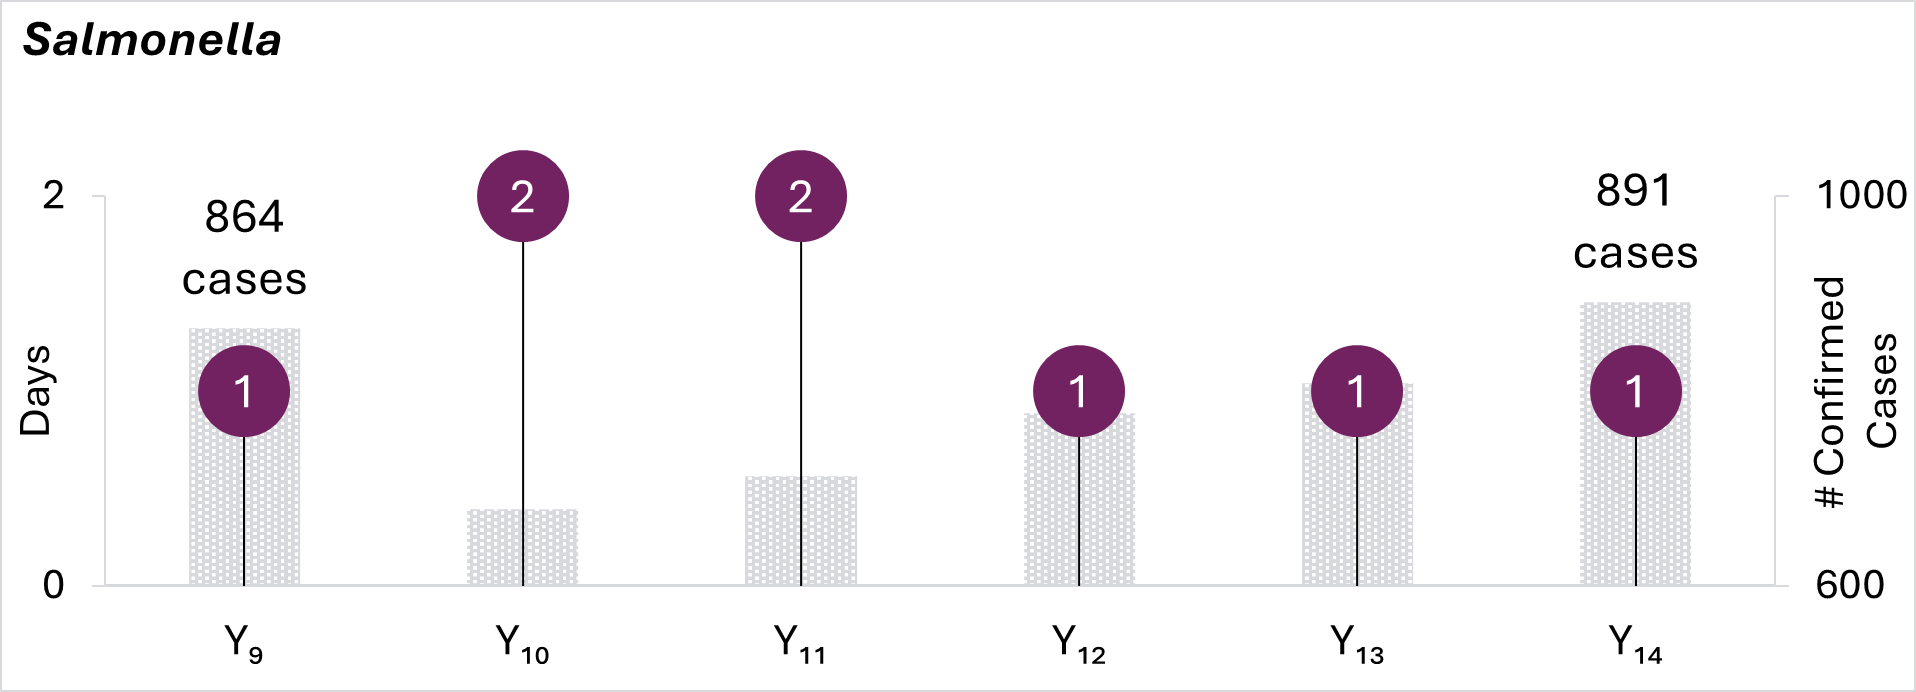
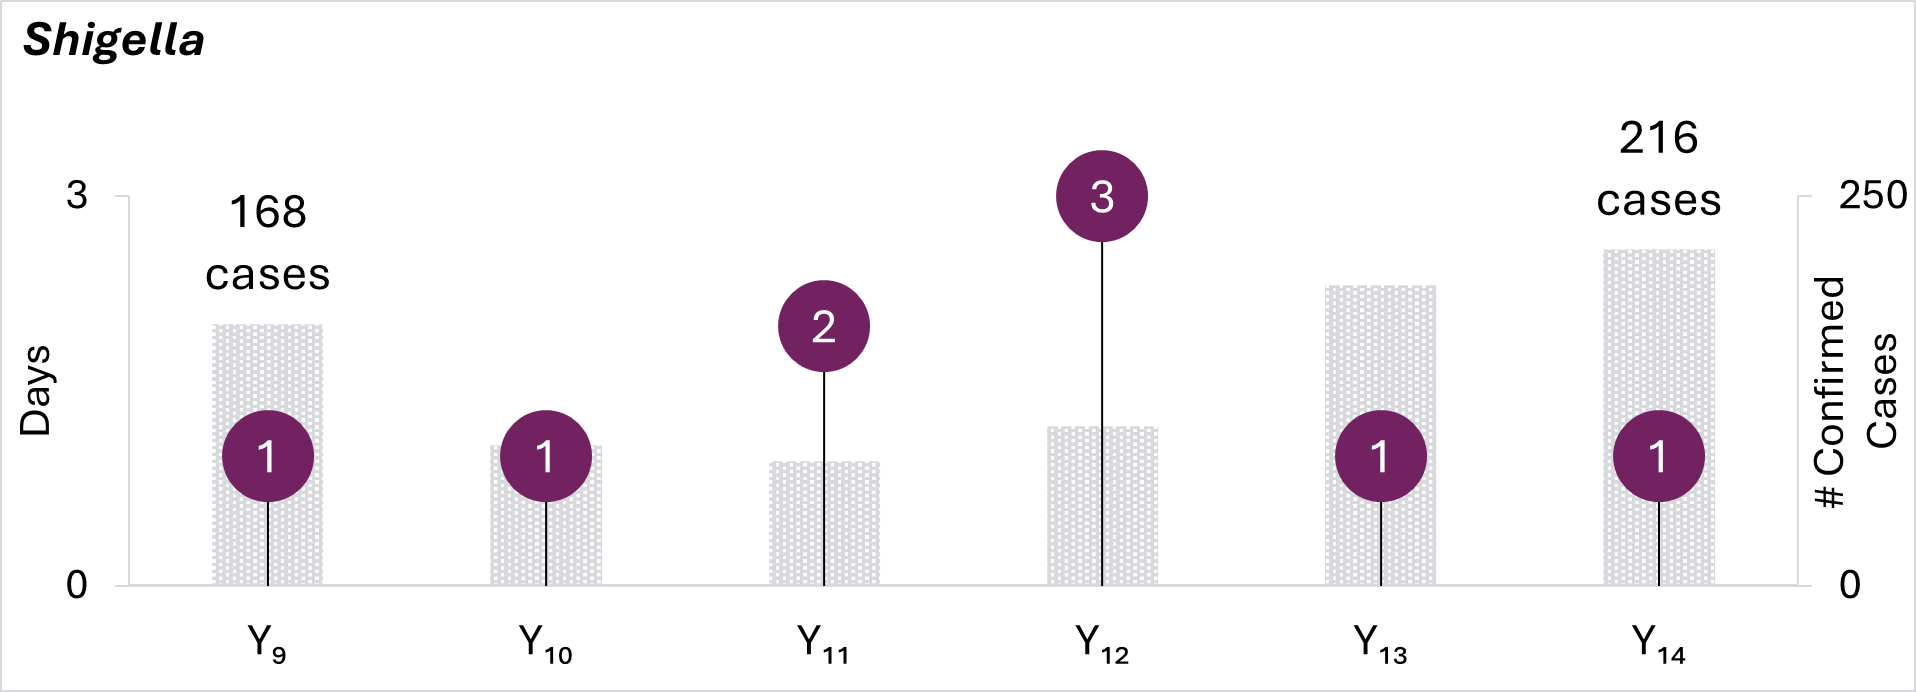
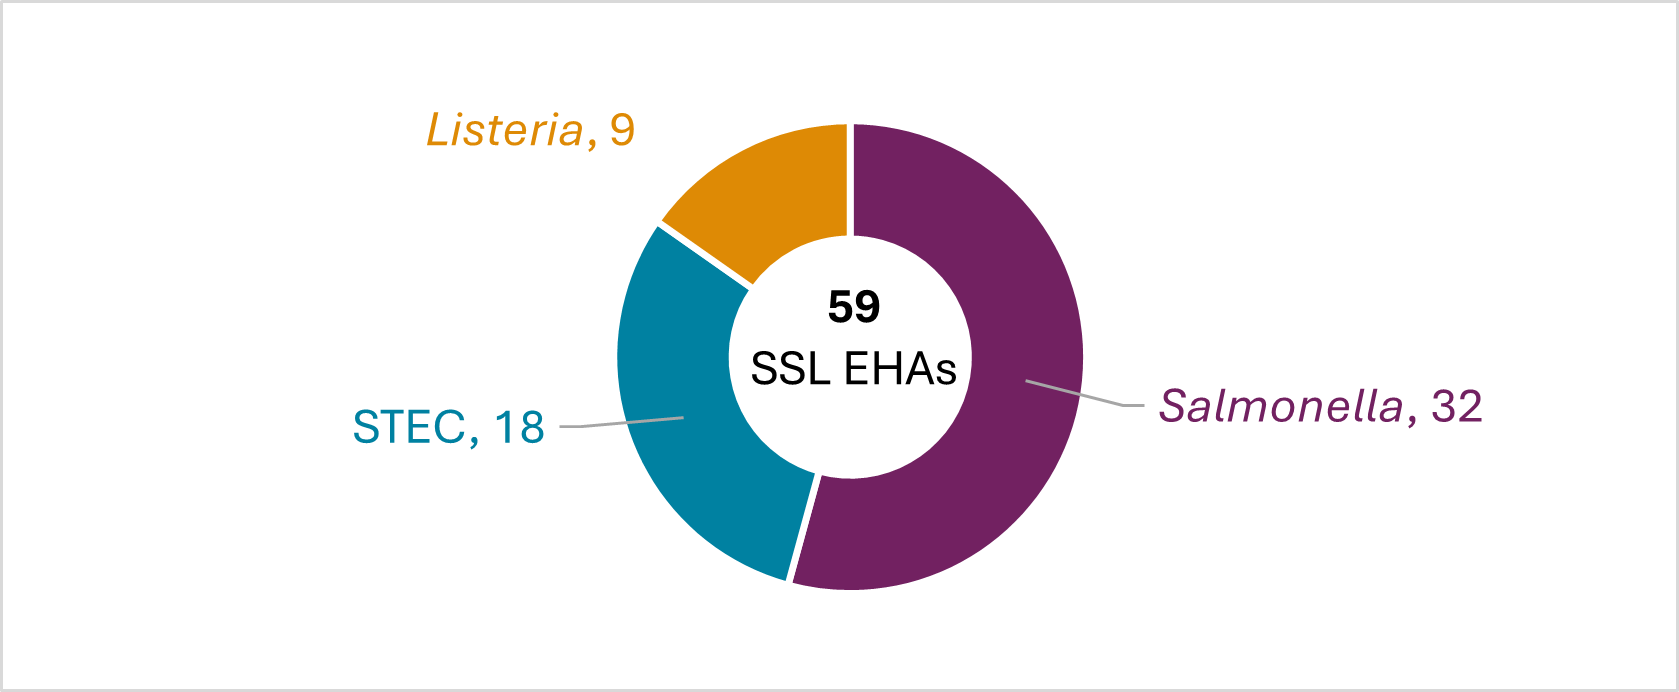
Figure 3
FoodCORE centers conducted more environmental health assessments in Year 14 compared to Year 13.
In Year 14, FoodCORE centers conducted 59 SSL and 157 NOU environmental health assessments (EHAs) as part of investigations where there was a link to a common source of exposures, compared to Year 13 at 48 and 120, respectively.

- Time in median days
- Only foodborne and point-source investigations are reported for NOU metrics
- FoodCORE Program Years:
- Baseline (Y0) = Oct 2010 – Mar 2011
- Year 1 (Y1) = Oct 2010 – Sept 2011
- Year 2 (Y2) = Oct 2011 – Dec 2012
- Year 3 (Y3) = Jan 2013 – Dec 2013
- Year 4 (Y4) = Jan 2014 – Dec 2014
- Year 5 (Y5) = Jan 2015 – Dec 2015
- Year 6 (Y6) = Jan 2016 – Dec 2016
- Year 7 (Y7) = Jan 2017 – Dec 2017
- Year 8 (Y8) = Jan 2018 – Dec 2018
- Year 9 (Y9) = Jan 2019 – Dec 2019
- Year 10 (Y10) = Jan 2020 – Dec 2020
- Year 11 (Y11) = Jan 2021 – Dec 2021
- Year 12 (Y12) = Jan 2022 – Dec 2022
- Year 13 (Y13) = Jan 2023 – Dec 2023
- Year 14 (Y14) = Jan 2024 – Dec 2024
- SSL 2b. Percent of preliminary positive clinical specimens or samples received at the PHL that yielded isolates
- SSL 4. Time from receipt of isolate-yielding specimens at PHL to recovery of isolates
- SSL 9a. Number of laboratory confirmed cases reported to epidemiology staff
- SSL 10b. Time from confirmed and probable case report to initial interview attempt
- SSL 16. Number of investigations with a link to a common location of exposures (e.g., restaurant, food establishment, nursing home, etc.) where an environmental health assessment was conducted
- NOU 7. Number of foodborne or point-source investigations with link to a common location of exposures (e.g., restaurant, food establishment, nursing home, etc.) where an on-site environmental assessment was conducted