Key points
Best Practices
The WCMS offers several settings for filter controls. You can control the sort order for each filter's selection list. You can include a reset option. And you can select the type of control for each filter: dropdown, tab, pill button, or tab bar.
Remember to test the usability of filterable visualizations, particularly when mixing control types. We recommend that you consult with your organization's accessibility officer.
Additionally, on the legends panel, for some map types you will be able to select a "Unified Legend". This will set the legend categories to the same range across all filter options.
Quick Build Notes
- Select a map as the Visualization Type.
- Upload your data.
- Type in the title and other text fields in the General panel.
- Select the Geography column.
- Select the Data Column.
- Add one or more filters in the Filter panel.
Configuration Options
The example visualizations below highlight options available for filtered maps. Key configuration selections are in the build notes section under each example.
Don't forget to check out the General Map page for additional map guidance.
For in-depth configuration information visit the Configuration Options section.
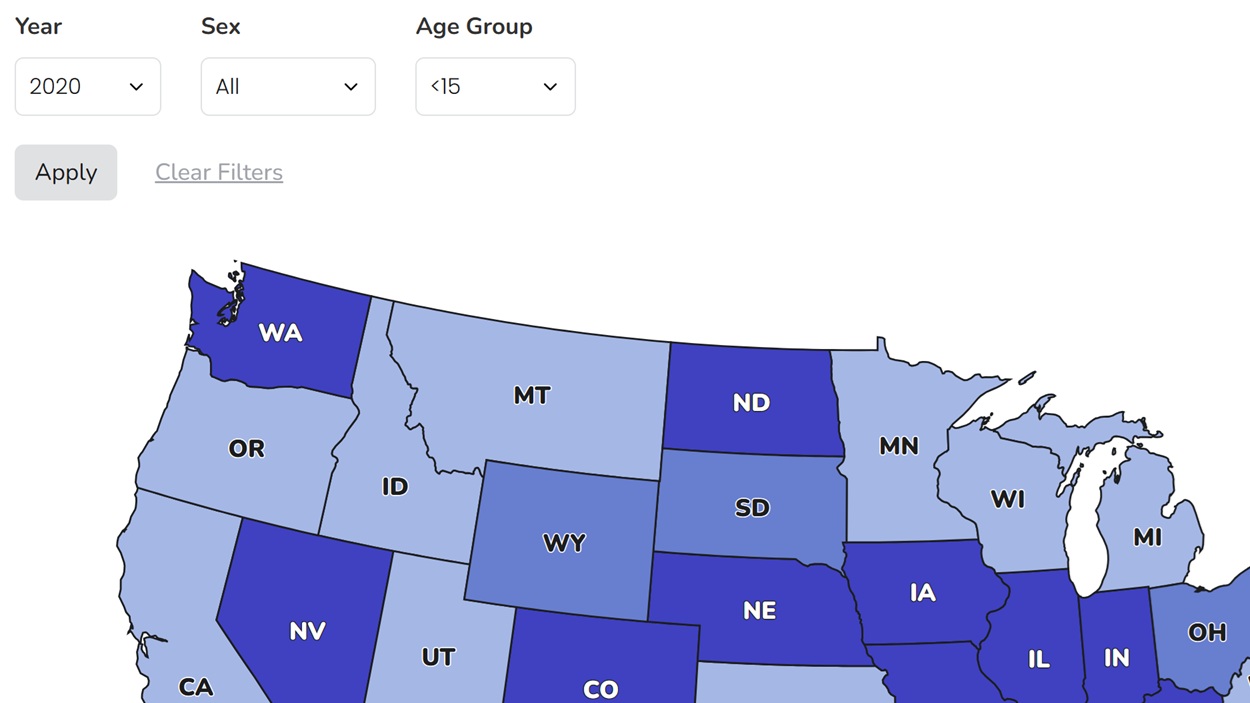
Example Filterable Map with Multiple Filters and Buttons
This data map uses buttons to apply and reset the filters. This is considered the best approach for Section 508 compliance. This map also uses the unified legend.
Sample Data: Filterable Map Data
- Vertical
- Multiple series: No
- Geography: United States
- Geography subtype: US State-Level
- Show State Labels
- Geography: Location
- Data Column: Cases per 100K
- Legend Type: Equal Number (Quantiles)
- Legend Position: Bottom
- Legend Style: Boxes
- Single Row Legend
- Use New Quantile Legend
- Unified Legend
- Filter Behavior: Apply Button
- Add Filter - Label: Year, Filter Column: Year, Filter Style: Dropdown, Filter Order: Descending Alphanumeric, Default Value Set by Query String Parameter: filter1
- Add Filter - Label: Sex, Filter Column: Sex, Filter Style: Dropdown, Filter Order: Ascending Alphanumeric, Default Value Set by Query String Parameter: filter2
- Add Filter - Label: Age Group, Filter Column: Age Group, Filter Style: Dropdown, Filter Order: Ascending Alphanumeric, Default Value Set by Query String Parameter: filter3
- Default City Style: Diamond
Example Map with Tab Filters
This map has a single filter with tab controls and no reset option. Note that this map does not use a unified legend.
Sample Data: Tab Filterable Data
- Vertical
- Multiple series: No
- Geography: United States
- Geography subtype: US State-Level
- Geography: State
- Geography Label: State
- Data Column: Cases per 100K
- Legend Type: Equal Number (Quantiles)
- Separate Zeros
- Use New Quantile Legend
- Number of Items: 6
- Filter Behavior: Filter Change
- Add Filter - Filter Column: Year, Filter Style: Tab, Filter Order: Descending Alphanumeric, Default Value Set by Query String Parameter: filter1
- Default City Style: Triangle
- Label (Optional): Locations