


Key points
Best Practices
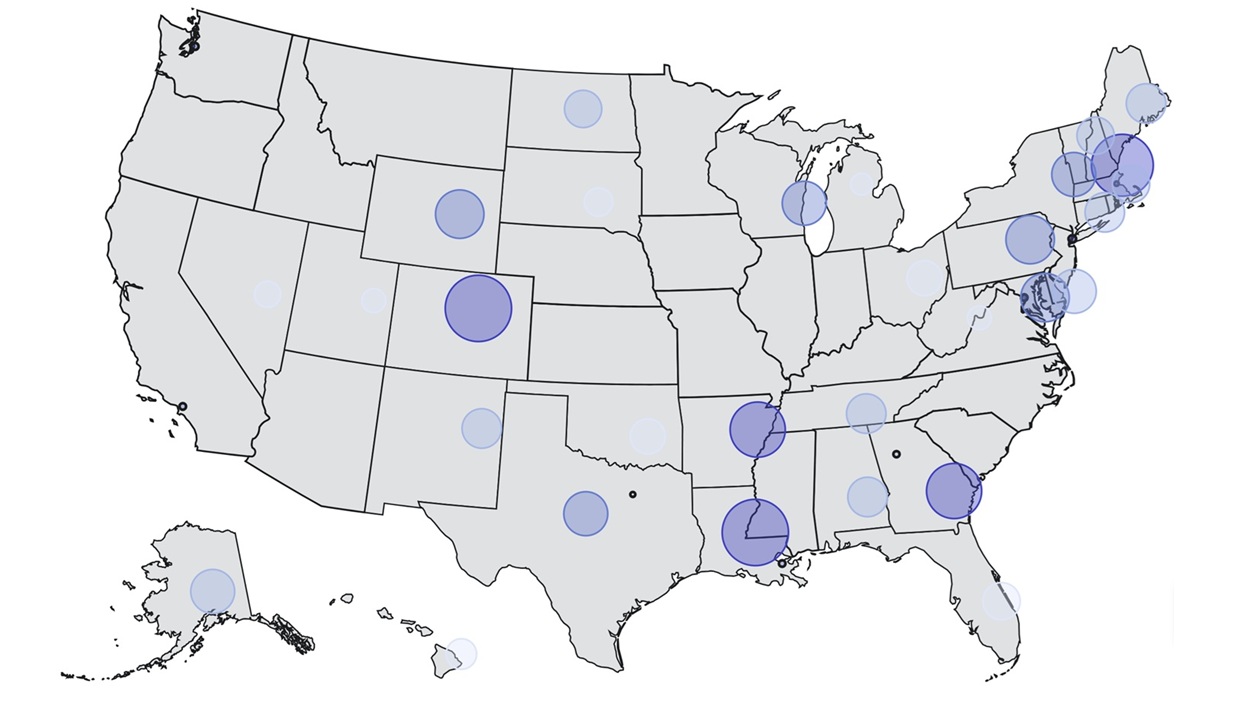
This style map gives the page user a quick contrast view of regional severity and where high occurrences are. The bubble map can also help reduce the size bias of smaller regions representing smaller numbers. This is because the circles represent the total number of occurrences, not the geographical boundaries. A Bubble Layer can be added to US and World maps. The bubbles can be located based on geographic data or on latitude & longitude.
A drawback to this style map can be visual confusion if overlapping smaller regions have overly large circles. We've added transparency to the "bubbles" and the ability to control the size of the circles to help mitigate this issue. Over plotting can also be a potential issue with this style of map. If a majority of the map would end up having bubbles, consider a standard data map.
Quick Build Notes
- Select a map as the Visualization Type.
- Upload your data.
- Type in the title and other text fields in the General tab.
- Use the Bubble Layers panel to add a bubble layer.
- Add the necessary data details, including Lat/Long (or Data Column) settings, Coloring and Size details.
- Configure the Visual settings of the bubbles.
- Configure the legend settings.
- Adjust additional Map settings as needed.
Configuration Options
The example visualizations below highlight options available for bubble maps. Key configuration selections are in the build notes section under each example.
Don't forget to check out the General Map page for additional map guidance.
For in-depth configuration information visit the Configuration Options section.
Example Bubble Layer on a US Map
A map of the United States with a bubble layer and state data. This example visualization shows the number of amusement park rides and their location (as bubbles) atop state population data.
Sample Data: Bubble Map Example - US Theme Park Locations
- Vertical
- Multiple Series: No
- Geography: United States
- Map Type: Data
- Data Classification: Numeric/Quantitative
- Geography: State
- Data Column: State Population (2020 Census)
- Type: Equal Number
- Position: Top
- Legend Style: Gradient / Linear Blocks
- Number of Items: 5
- Bubble Location: Lat/Long
- Label Column: Theme Park
- Latitude Column: Latitude
- Longitude Column: Longitude
- Coloring Field: Approx. Number of Rides
- Size Column: -Same as Coloring Field-
- Bubble Size - Min: 12 Max: 20
- Bubble Opacity: 0.9
- Color Palette: sequential_blue
- Show Legend: Checked
- Data Classification Type: Numeric/Quantitative
- Legend Type: Equal Number
- Legend Style: Circles
- Number of Items: 5
Example Bubble Layer on a World Map
A map of the world (centered on Africa) with a bubble layer. This example visualization shows population growth (as bubbles) atop country population data.
Sample Data: Bubble Map Example - Top 25 African Cities
- Vertical
- Multiple Series: No
- Geography: World
- Zoom Focus: Africa
- Map Type: Data
- Data Classification: Numeric/Quantitative
- Geography: Country
- Data Column: Estimated Population
- Type: Equal Number
- Position: Top
- Legend Style: Gradient / Linear Blocks
- Number of Items: 5
- Bubble Location: Lat/Long
- Label Column: City
- Latitude Column: Latitude
- Longitude Column: Longitude
- Coloring Field: Annual Urban Population
- Size Column: -Same as Coloring Field-
- Bubble Size - Min: 5 Max: 13
- Bubble Opacity: 0.9
- Color Palette: sequential_blue
- Show Legend: Checked
- Data Classification Type: Numeric/Quantitative
- Legend Type: Equal Number
- Legend Style: Circles
- Number of Items: 5
Example Filterable Bubble Style World Map
The data set has 5 categories that are filtered so as to avoid too many bubbles in the same general area. Note that on Categories 3 and 4 there is still significant crowding in the Caribbean that could cause confusion, but all bubble are accessible with the hover tooltips.
This chart also uses a dynamic legend description. As you make selections in the filter dropdown, you can see the description change.
Sample Data: Example Bubble Style World Map
- Vertical
- Multiple Series: No
- Geography: Country
- Data Column: Rate
- Navigation: URL
- Additional Column: URL, Label: Link to Related Country Site, Show in Data Table
- Legend Position: Bottom
- Dynamic Legend Description
- Filter Behavior: Apply Button
- Minimum Bubble Size: 1
- Maximum Bubble Size: 18
- Allow Map Zooming
- Bubble Map Has Extra Border
This page was last updated on this date. Updates may include minor edits, image changes, or other modifications to page content.
The information on this page was last reviewed by subject matter experts to ensure accuracy.