At a glance
Overview
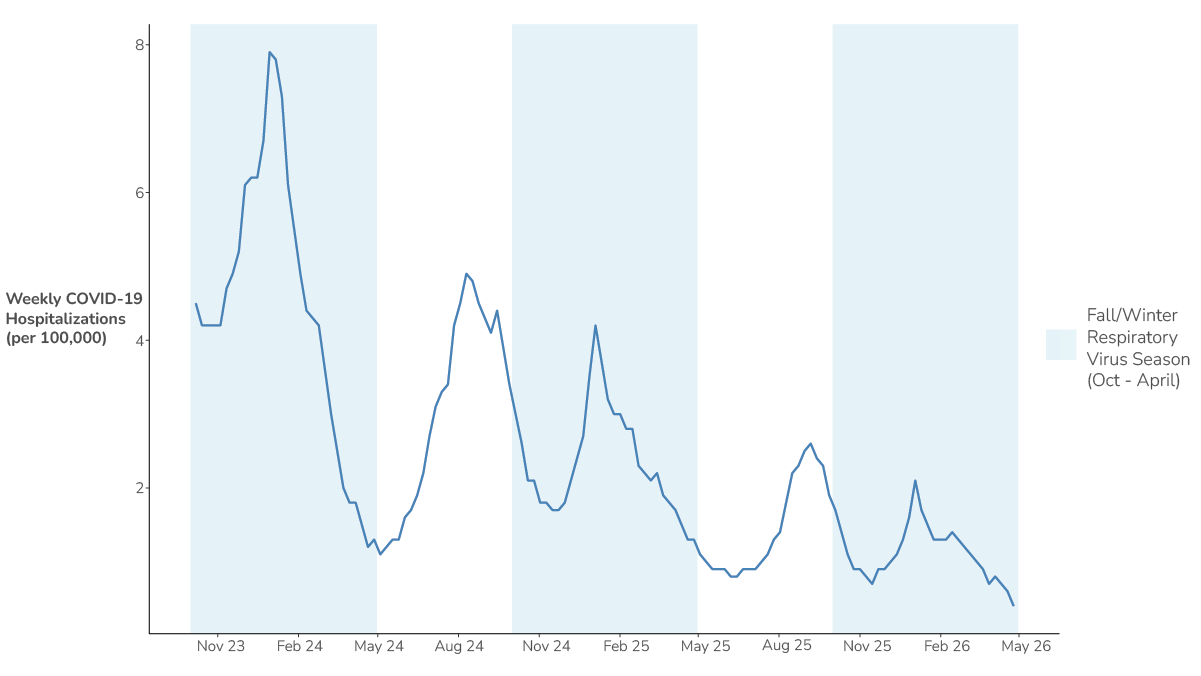
Since SARS-CoV-2 emerged in late 2019, hospitalizations due to COVID-19 have varied seasonally, with peaks occurring in both summer and winter months (Figure 1). Although peak hospitalization rates due to COVID-19 vary by state and region, the magnitude of national peak hospitalization rates due to COVID-19 during both summer and winter increases have decreased over time. Following the increase in COVID-19 during the 2023/2024 fall and winter respiratory season, the national peak hospitalization rate due to COVID-19 has been lower in each subsequent wave of transmission. The decreasing levels of national COVID-19 hospitalizations over time could be due to several potential factors, which are not mutually exclusive, including:
- No new variants with significant immune-escape properties: A variant with significant immune-escape properties has not emerged and achieved predominance since the emergence of JN.1 in 2024. COVID-19 hospitalizations could be declining over time because no new variants with increased abilities to evade an individual's prior immunity have emerged and reached predominance in the past 2 years.
- Lower disease severity:
- Due to lower virulence of predominating variants: If disease severity of predominating variants has decreased compared to earlier waves, the number of COVID-19 hospitalizations could be lower.
- Due to diverse individual-level immunity: Most people have some level of immunity to COVID-19 from multiple past infections and vaccinations. Hospitalizations may be decreasing over time because individuals' immunity is more effective at preventing severe outcomes when infections occur. The diversity of immunity (e.g. history of heterogeneous immune exposures within individuals) continues to expand over time as people experience reinfections and/or receive COVID-19 vaccinations.
- Reduced case reporting: Decreases in testing for SARS-CoV-2 infection in hospitals or decreases in hospitals reporting to national surveillance systems may be contributing to lower reported numbers of hospitalizations due to COVID-19.
Given the historical trend nationally of significant increases of COVID-19 activity occurring in the summer months, this outlook is intended to provide decision-makers with information to assist in public health preparedness for COVID-19 activity during summer 2026. CDC's outlook is based on historical trends, expert opinion, and scenario modeling results. See our Respiratory Disease Season Outlooks from the 2024-2025 season and 2025-2026 season for insights into how scenario modeling has been used in the past to demonstrate the range of possibilities for how the respiratory disease season could unfold.
Outlook for the summer months
National Outlook
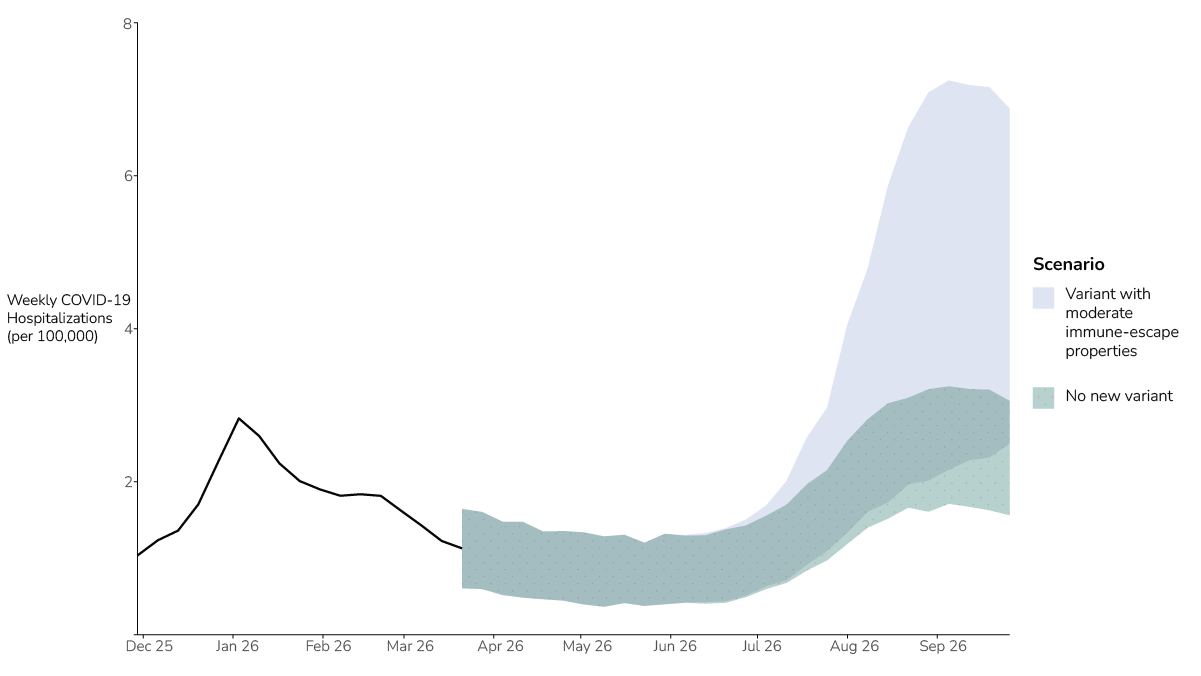
While the past several waves have shown a trend of declining hospitalizations nationally, it remains possible that there could be a larger increase this summer. There is regional variability in both the timing and magnitude of COVID-19 activity. We developed two COVID-19 modeling scenarios for the summer to demonstrate the range of possibilities for how COVID-19 activity could unfold nationally. One scenario assumes that no variant with significant immune-escape properties emerges; the other is based on the possible emergence of a variant with moderate immune-escape properties that achieves predominance. The latter scenario is based on the characteristics that were observed in variants that emerged in the United States in the pastA. While not specifically modeled in this scenario, we note that since its first detection in the U.S. in 2025, there have been detections of BA.3.2 in at least 29 U.S. states and Puerto RicoB. These modeling results show that in the absence of the emergence of a variant with moderate immune-escape properties, we do not expect an increase substantially larger than that experienced this past winter (Figure 2). If such a variant does emerge, there is substantial uncertainty (Figure 2), but modeling suggests increases would likely be within the range of what has been observed in the past 3 years (Figure 1).
Regional Outlook
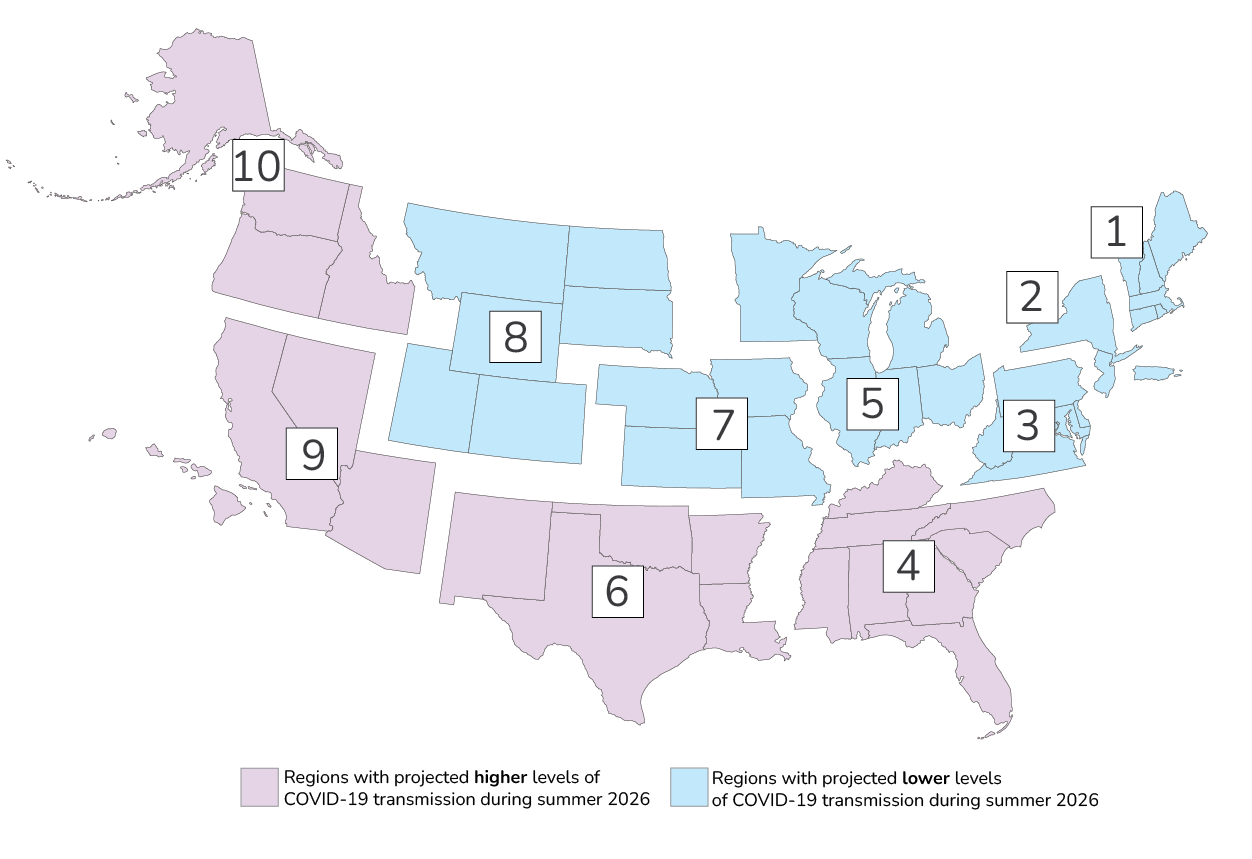
There is regional variability in both the timing and magnitude of COVID-19 hospitalization across the United States (Figure 3). Historical data from the past two years indicates that in many regions of the United States, one COVID-19 wave is occurring each year (either during the summer or fall/winter months), instead of two waves. Scenario modeling results by HHS Region indicate that broadly, regions fall into two groups:
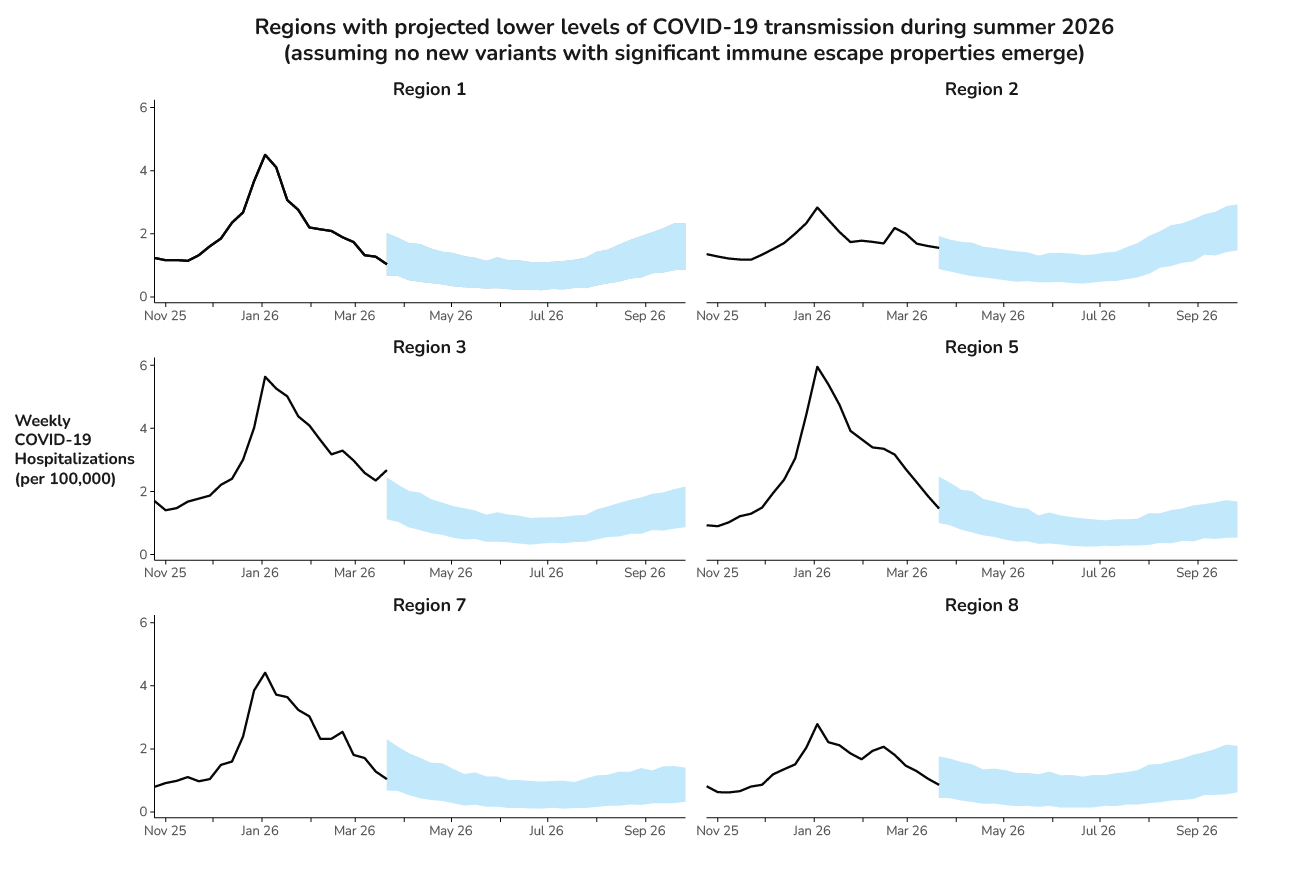
- Regions with projected lower levels of transmission during summer 2026: In regions that experienced substantial COVID-19 activity during the most recent winter months (the 2025-2026 fall and winter respiratory season), scenario modeling suggests that there will be a lower level of COVID-19 transmission relative to both the past winter and the other regions, and therefore lower numbers of hospitalizations, during the upcoming summer months (Figure 4). Lower projected activity during the summer could be due to increased population immunity to COVID-19 following higher levels of infection during the preceding fall and winter months.
- This group includes HHS Regions 1, 2, 3, 5, 7, and 8, which make up the northeast and midwestern parts of the country. We note that HHS Region 2 has intermediate projected dynamics, with somewhat higher projected activity during summer 2026 than the other regions in this group, but lower than the second group.
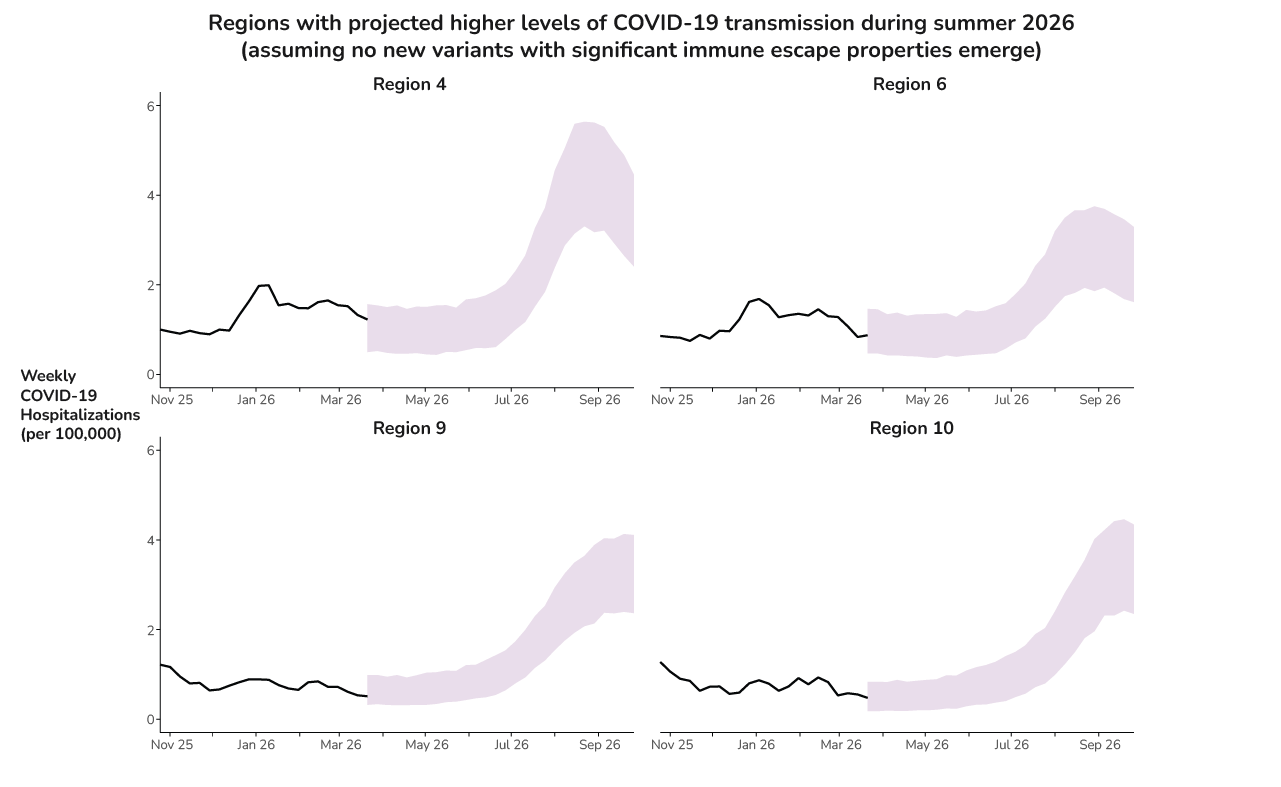
- Regions with projected higher levels of transmission during summer 2026: In regions that did not experience substantial COVID-19 activity during the most recent winter months (the 2025-2026 fall and winter respiratory season), scenario modeling suggests that there will be a higher level of COVID-19 transmission relative to both the past winter and the other regions, and therefore higher numbers of hospitalizations, during the upcoming summer months (Figure 5). Higher projected activity during the summer could be due to lower population immunity to COVID-19 following low levels of infection during the preceding fall and winter months.
- This group includes HHS Regions 4, 6, 9, and 10, which make up the southern and western parts of the country.
For all regions, we note that the emergence of a variant with moderate immune-escape properties could lead to higher numbers of hospitalizations and drive higher summer increases in any part of the country. Also, trends observed in these two groups—primarily winter vs primarily summer transmission—may persist or change over time. We note uncertainty in the following areas:
- COVID-19 dynamics are evolving, and there is uncertainty in the role of seasonality on transmission of SARS-CoV-2. Many behavioral or environmental factors could contribute to more effective transmission of the virus at certain times of the year and in certain geographic regions.
- This model represents the 50 states individually and does not include the possibility that high levels of transmission in one state will spill over into other states as people move between regions. It is possible that the movement of infected people across state and regional boundaries could contribute to small increases in areas where the model does not currently project significant activity.
- The model does not account for the upcoming 2026 World Cup, co-hosted by the United States. There is uncertainty in how social mixing during the World Cup will affect COVID-19 dynamics this summer, although the current modeling approach does include wide bands of uncertainty that likely account for modest increases in COVID-19 activity occurring due to the World Cup.
Methods
This outlook is based on expert opinion, historical data, and scenario modeling results. We have moderate confidence in our assessment, based on information availability and information gaps and assumptions.
We project COVID-19 dynamics under different scenarios using a transmission model with a compartmental modeling structure that takes into account population age structure, infection history, vaccination history, immunity waning status, and SARS-CoV-2 variants. See our Scenario Modeling Methods page to learn more about our methods.
- The model assumes that a variant is introduced with moderate immune-escape properties, similar to properties of XEC. The variant is introduced across projections with a peak introduction time that varies randomly between model runs, between June 15, 2026 and September 13, 2026. This range is intended to capture uncertainty in when variant emergence might occur. Each introduction gradually increases over the two weeks prior to the peak and decreases for the two weeks following the peak.
- In laboratory studies BA.3.2 was found to possess immune escape properties; however, its prevalence within the U.S. has remained relatively low, at 4% (95% CI = 3-7%) of sequences collected during March 15, 2026- April 11, 2026.