What Data Are Used to Measure Cancer Health Disparities?

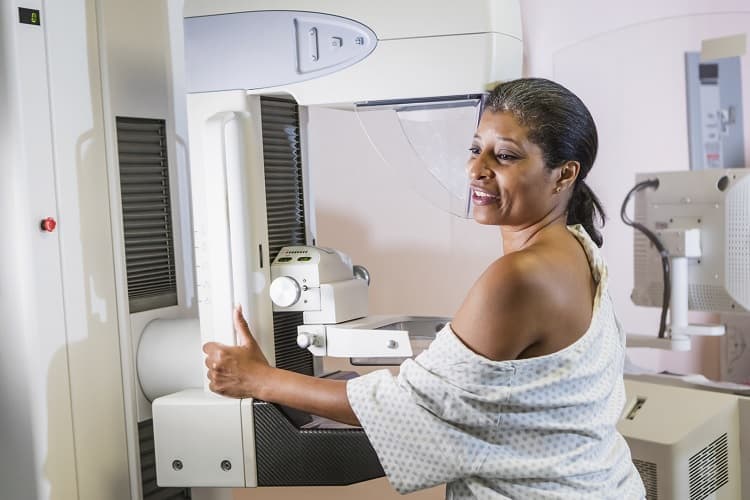
Breast cancer is more likely to be found at a later stage among non-Hispanic Black women compared to non-Hispanic White women.1
Researchers use certain measurements to describe how much a group of people is affected by cancer. Some common measurements that can show cancer health disparities include—
- Incidence rate: the number of new cancer cases per 100,000 people in a year. For example, in 2019 in Kentucky, 505 out of every 100,000 people got cancer, while 367 out of every 100,000 people in New Mexico got cancer.1
- Mortality (death) rate: the number of people who died of cancer per 100,000 people in a year. For example, in 2019 in the United States, 171 out of every 100,000 non-Hispanic Black people died of cancer, compared to 151 out of every 100,000 non-Hispanic White people.1
- 5-year survival: the percentage of cancer patients who have not died from their cancer within a certain time frame, such as 5 years after diagnosis. For example, in 2019, about 66% of non-Hispanic White people with cancer in the United States were alive 5 years after their cancer diagnosis, compared to about 63% of non-Hispanic Black people with cancer.1
- Screening prevalence: the percentage of people who have been screened for a certain kind of cancer. For example, in the United States in 2018, about 77% of women with health insurance were up to date with breast cancer screening, compared to about 40% of women without health insurance.2
Cancer Registry Data Lay the Groundwork for Measuring Disparities
Cancer registries provide the data-driven foundation for cancer control efforts in the United States. Find out what they are, how they work, and who can use the data they provide in this video.
CDC’s National Program of Cancer Registries works with the National Cancer Institute to collect cancer data for the entire US population. These data are published every year in United States Cancer Statistics, and you can see them online in the Data Visualizations tool.
Researchers, clinicians, policy makers, health advocates, and public health professionals can use these data to—
- Learn which groups of people are most affected by cancer.
- Find out how well cancer prevention programs work.
- See which communities need more help with cancer prevention and control.
- Work with community leaders and partners to build and improve cancer prevention programs.
- Develop resources to reach communities with higher cancer rates.
Learn how CDC is working to improve the accuracy of cancer data for American Indian and Alaska Native people.
Cancer Registry Data Lead to Action
South Carolina has a high rate of cancer deaths, especially from breast and cervical cancer. Cancer death rates are also higher among Black women than White women in the state. To help reduce this disparity, state officials used cancer registry data to develop the Can Screen Initiative to reach more Black people to make sure they get the treatment they need.
Kentucky Cancer Registry data showed that the rate of common childhood cancers is higher in Kentucky than in the overall United States. The data also showed that childhood cancer rates are even higher in Kentucky’s Appalachian region. In response, the state legislature established the Kentucky Pediatric Cancer Research Trust Fund in 2015 to find out why children in Kentucky have high cancer rates.
Since 2011, cancer programs in Delaware have worked to educate men, especially Black men, about the risk of getting prostate cancer. The Delaware Cancer Registry provides detailed information about new cases of, and deaths from, prostate cancer. Although the rate of getting prostate cancer is high in Delaware, the 5-year average death rate has dropped by nearly one-third in the past 10 years. Much of this decrease is because fewer Black men are dying from the disease.
References
1U.S. Cancer Statistics Working Group. U.S. Cancer Statistics Data Visualizations Tool, based on 2021 submission data (1999–2019): U.S. Department of Health and Human Services, Centers for Disease Control and Prevention and National Cancer Institute; www.cdc.gov/cancer/dataviz, released in June 2022.
2Sabatino SA, Thompson TD, White MC, Shapiro JA, de Moor J, Doria-Rose P, Clarke T, Richardson LC. Cancer screening test receipt—United States, 2018. MMWR 2021;70:29–35.