Calculating Probability of Causation (PC)
Under the Act (42 CFR Part 81) [184 KB (20 pages)], the probability of causation (PC) is calculated as the risk of cancer attributable to radiation exposure (RadRisk) divided by the sum of the baseline risk of cancer to the general population (BasRisk) plus the risk attributable to the radiation exposure, then multiplied by 100 percent, as follows:
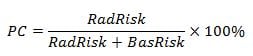
PC is expressed as a percentage between 0 and 100 percent. A value of 100% means it is certain that the radiation dose was the cause of the cancer. A value of 0% means it is certain that the radiation dose was not the cause of the cancer.
The Department of Labor (DOL) calculates the worker’s PC and determines whether his or her cancer was “at least as likely as not” (i.e., a PC of 50% or greater) related to their workplace radiation exposure. The Act requires these determinations be based on the upper 99% credibility limit, to ensure each worker is given the benefit of the doubt before a final compensation decision is made. In other words, there is only 1 chance in 100 that the true PC value could be greater than the value used by DOL to determine compensation. This favorable approach ensures that the worker’s PC not underestimated.
If the PC is 50% or greater, the energy worker (or his or her survivors) is eligible for compensation from DOL: $150,000, plus medical benefits for surviving energy workers for their cancer treatment.
DOL uses a computer software application NIOSH developed in collaboration with the National Cancer Institute, called NIOSH-IREP, to determine PC. More information on this tool can be found on our NIOSH-IREP page.
Compensation Results by NIOSH-IREP Cancer Model
The table in the link below shows the compensation rates for cases with dose reconstructions approved by NIOSH and sent to DOL through February 6, 2026. The results were generated using the NIOSH-IREP cancer risk models.
- Compensation Results by NIOSH-IREP Cancer Model (Data Table) [327 KB (1 page)]
- Compensation Results by NIOSH-IREP Cancer Model (Bar Chart) [331 KB (2 pages)]
A cancer risk model is a mathematical model that describes the relationship between a known amount of radiation exposure and the risk of developing a given type of cancer. These models are used to estimate an individual’s PC using information on the radiation dose to the organ or tissue that developed cancer and personal data such as sex, age at exposure, and age at diagnosis.
The Compensation Results table shows the compensation rates for each of the 33 individual cancers risk models available in NIOSH-IREP, as well as the overall compensation rates for single primary cancers, multiple primary cancers, and overall for all cases combined. The overall compensation rate for all cases that had a dose reconstruction approved by NIOSH and were submitted to DOL through February 6, 2026, is 25.8%. The compensation rate for single primary cancers is 23.4%, and the compensation rate for multiple primary cancers is 30.5%.
PC Values for Various Levels of Acute Radiation Exposure
The graphs that can be accessed in the link below show the relationship between PC and acute exposure (i.e., exposure that occurs over a short time period) to ionizing radiation for the cancer models in NIOSH-IREP. Although these graphs are not useful for predicting the PC for an individual case, they can be used to examine the relative differences in radiation sensitivity among organs for two selected ages at diagnosis.
These graphs show the changes in the PC at various doses for two scenarios. The red line represents a person whose cancer was diagnosed at 40 years of age, and the blue line represents a person whose cancer was diagnosed at 50 years of age. In addition, the following parameters were used in making these graphs:
- Male (except in the case of breast or ovarian cancer)
- One acute exposure to high energy (i.e. >250 keV) photons
- The latency period (the time from the first occupational exposure to radiation to the time when the cancer was diagnosed) was 20 years for most of the solid cancers, but was 10 years for leukemia, bone or thyroid cancer
- In case of lung cancer, there are three different smoking history included: Never smoked, Former smoker, and Current smoker with an unknown number of cigarettes per day
As described above, these graphs depict the PC for a specific scenario and therefore cannot be used to interpret the outcome of a specific case.