Chapter 20: Analysis of Surveillance Data
Author: Sandra W. Roush, MT, MPH
Background
Ongoing analysis of surveillance data is important for detecting outbreaks and unexpected increases or decreases in disease occurrence, monitoring disease trends, and evaluating the effectiveness of disease control programs and policies. This information is also needed to determine the most appropriate and efficient allocation of public health resources and personnel.
Analyses should be performed at regular intervals to identify changes in disease reporting. These analyses can be performed using standard approaches (e.g., running a standard computer program to generate a summary report). Findings of analyses should be reviewed regularly and provided as feedback to medical providers and others in the community who are asked to report cases. Often additional, special analyses are needed to answer specific questions that arise;[1] these analyses may require additional customized approaches beyond those routinely performed.
Analyses can be done using any one of a number of database and statistical programs. Systems developed by Centers for Disease Control and Prevention (CDC) and others can assist in epidemiologic and laboratory surveillance, outbreak detection, and mapping. Local health departments should contact the state health department for information about recommended software and to identify support for setting up a surveillance database at a local level. The state health department may also give assistance in setting up useful analyses and reports that can be generated as needed.
Although computer technology has greatly facilitated collection and analysis of surveillance data, surveillance of most vaccine-preventable diseases in the United States results in small numbers of cases, and data analysis is not complex (see examples included in this chapter). In addition, skillful interpretation of the data is needed to determine why any aberrations may be occurring or to decide whether additional action is necessary. Therefore, both technologic and human factors play important roles in analysis of surveillance data. Despite the increased speed and accuracy of a sophisticated trend analysis, it must be supplemented by familiarity with the people and the disease patterns in a community and with the reporting system being used.
The mistake most commonly made in analysis and use of public health surveillance data is not related to statistical testing, improper presentation of data, or failure to perform complex multivariate analyses; the most common mistake is not looking at the data. Computer hardware and software can facilitate the epidemiologist’s task, but they are no substitute for looking, thinking, discussing, and taking action.
The Analytic Process
Analysis of surveillance data begins with characterizing the pattern of disease reports by person, place, and time. Patterns of disease reports should be compared at different times (e.g., the number of mumps cases reported in 2005 compared with the number of cases in 2006); in different places (e.g., the number of pertussis cases reported in one district compared with the number in another district); and among different populations (e.g., the number of measles cases reported among infants, preschool age children, school age children, adolescents, and adults). Vaccination status of case-patients should also be examined; if there is disease transmission in the community, lack of vaccination is likely to be a factor most strongly associated with illness. Analyses that examine delays in reporting, completeness of reporting of critical variables, and applying case definition criteria also are useful in evaluating the quality of case investigation and reporting and should be undertaken regularly. Missing or inaccurate data may limit the usefulness of any analysis. Erroneous or incomplete data cannot be corrected through statistical procedures.
Surveillance Data Analysis for Vaccine-Preventable Diseases in the United States
The following analyses of surveillance data should be performed routinely. Additional analyses may be needed under special circumstances; the state health department can provide additional guidance in routine and special analyses of surveillance data. The interpretations and possible action steps listed here are only examples to indicate some of the information that may be gained from the analysis.
By person
Describe the persons with vaccine-preventable diseases (case-patients) who were identified by your surveillance system. Attributes of the case-patients include age group, sex, and race or ethnicity.
It may be appropriate to stratify age groups based on recommended ages for vaccine administration (e.g., separating those too young to be vaccinated from those eligible for vaccination), as well as on the age distribution of persons with reported cases. Age groups should span a narrower age range for ages in which disease incidence is highest and a broader age range in which disease incidence is lower.
| Age group | Frequency | Percentage (%) | Cumulative % |
|---|---|---|---|
| younger than 6 mo | 57 | 36.1 | 36.1 |
| 6-12 mo | 41 | 25.9 | 62.0 |
| 13-18 mo | 6 | 3.8 | 65.8 |
| 19-23 mo | 6 | 3.8 | 69.6 |
| 2-5 years | 18 | 11.4 | 81.0 |
| 6-9 years | 17 | 10.8 | 91.8 |
| 10 yrs or older | 12 | 7.6 | 99.4 |
| Age unknown | 1 | 0.6 | 100.0 |
| Total | 158 | 100.0 |
Interpretation. Pertussis cases are clustered among infants, with more than 60% of reported cases among those 12 months of age and younger (Figure 1). The occurrence of pertussis among infants younger than 6 months of age is extremely worrisome because these children are too young to have received three doses of pertussis vaccine. Note that it is difficult to draw any conclusions about disease incidence from these data; although these age-group divisions are logical for analysis of pertussis data, presentation of data in such unequal age groups may obscure important differences in disease incidence. Figure 2 shows the incidence of pertussis, by age group.
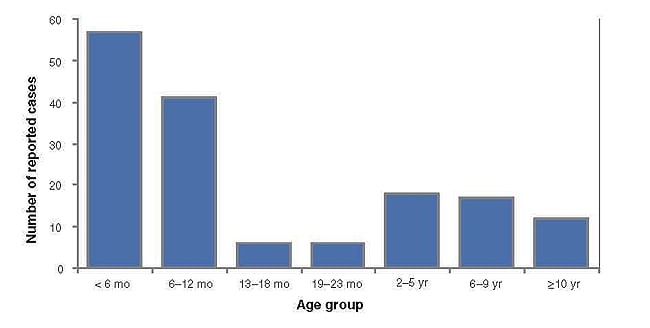
Figure 1. Pertussis cases by age group, 2011
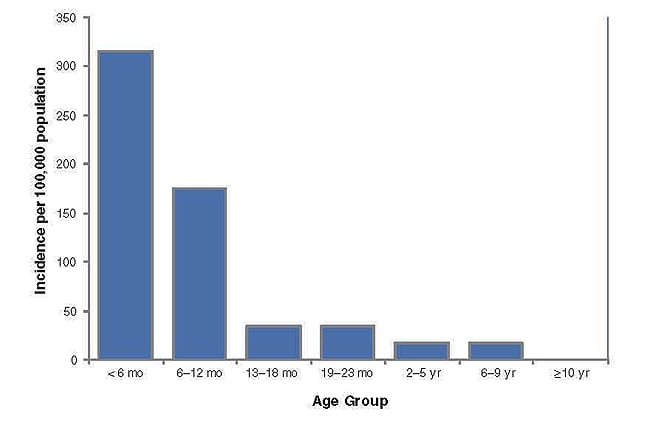
Figure 2. Pertussis incidence by age group, 2011
Example 2. Rubella cases by sex
| Sex | Frequency | Percentage (%) | Cumulative % |
|---|---|---|---|
| Female | 27 | 69.3 | 69.3 |
| Male | 12 | 30.7 | 100.0 |
| Total | 39 | 100.0 |
Interpretation. Of the 39 cases of rubella, more than two-thirds occurred among females. Assuming the population under surveillance includes approximately equal numbers of males and females, the female predominance among cases may reflect a real difference in disease incidence among females, possibly due to differences in susceptibility or exposure, or differences in ascertainment occurring because of concerns about rubella among women of childbearing age. The occurrence of rubella among women of childbearing age is of great concern because of the risk of congenital rubella syndrome (CRS) among infants born to women infected with rubella during the first trimester of pregnancy. Because many cases of rubella are asymptomatic or mild, there likely are many more cases than were reported. Subsequent surveillance for CRS in this community is essential.
Next steps. Look at cases among women by age group to identify women of childbearing age.
Example 3. Pertussis cases by Hispanic ethnicity, 2011
| Ethnicity | Frequency | Percentage (%) | Cumulative % |
|---|---|---|---|
| Hispanic | 32 | 20.35 | 20.3 |
| Not Hispanic | 77 | 48.7 | 69.0 |
| Unknown | 49 | 31.0 | 100.0 |
| Total | 158 | 100.0 |
Interpretation. Of the 158 cases of pertussis, one-fifth occurred among persons of Hispanic ethnicity, and almost half were among non-Hispanics. However, ethnicity was unknown for almost one-third of cases, suggesting that case investigation was incomplete.
Even if the data were complete, more information is needed to know how to interpret these proportions. What proportion of the population under surveillance is of Hispanic ethnicity? Do the data suggest a disproportionate burden of disease in one group? Reports indicating a disproportionate disease burden could result from low rates of vaccine coverage, increased disease incidence in certain neighborhoods or communities, or different levels of reporting, which might be due to differences in access to medical care and diagnostic testing or differences in reporting practices among providers. (For example, public clinics may be more likely to report cases than private physicians.)
Next steps. Obtain missing data, if possible; calculate incidence rates by ethnicity; look for geographic clustering.
By place
Describe the persons with vaccine-preventable diseases (cases) detected by your surveillance system by geographic location. Location may be defined as the place where the case was first reported, place of residence of the case-patient, or place of hospitalization. Location may be a state, city, county, or health district.
Example 4. Outbreak-related mumps cases by state, January 1–May 2, 2006.[2]
| State | Frequency | Percentage (%) | Cumulative % |
|---|---|---|---|
| Colorado | 1 | 0 | 0 |
| South Dakota | 27 | 1 | 1 |
| Nebraska | 201 | 8 | 9 |
| Kansas | 371 | 14 | 23 |
| Minnesota | 9 | 0 | 23 |
| Iowa | 1,487 | 57 | 81 |
| Missouri | 77 | 3 | 84 |
| Wisconsin | 176 | 7 | 90 |
| Illinois | 224 | 9 | 99 |
| Mississippi | 2 | 0 | 99 |
| Pennsylvania | 22 | 1 | 100 |
| Total | 2597 | 100.0 |
During January 1–May 2, 11 states reported 2,597 cases of mumps related to a multistate outbreak. The majority of mumps cases (n=1,487 [57%]) were reported from Iowa; states with the next highest case totals were Kansas (n=371), Illinois (n=224), Nebraska (n=201), and Wisconsin (n=176) (Figure 3).
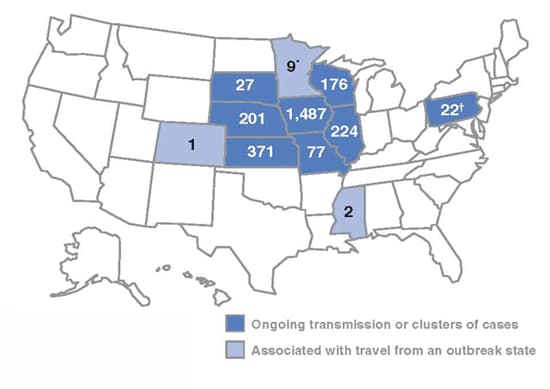
Figure 3. Outbreak-related mumps cases by state, January 1–May 2, 2006
N = 2,597
* Three cases related to the outbreak
† Twelve cases related to the outbreak
Interpretation. From January 1toMay 2, 2006, 11 states reported 2,597 cases of mumps related to the multistate outbreak. Eight states (Illinois, Iowa, Kansas, Missouri, Nebraska, Pennsylvania, South Dakota, and Wisconsin) reported mumps outbreaks with ongoing local transmission or clusters of cases; three states (Colorado, Minnesota, and Mississippi) reported cases associated with travel from an outbreak state. The majority of mumps cases (n=1,487 [57%]) were reported from Iowa; states with the next highest case totals were Kansas (n=371), Illinois (n=224), Nebraska (n=201), and Wisconsin (n=176).
By time
Describe the distribution of cases over time. Look for changes in the number of cases during the defined time period. Time intervals may be in years, months, weeks, or other unit of time. Date may be defined as date of onset of illness, date of diagnosis, or date of report to the health department. Analysis by date of symptom onset gives the most accurate representation of disease occurrence. Distribution of cases over time is most clearly presented as a graph with time on the x-axis and number of cases on the y-axis.
Compare the number of cases occurring in a current time period with the number reported during the same time period in each of the last 5 years. Compare the cumulative number of cases year-to-date with the cumulative number of cases year-to-date of previous years.
Example 5. Reported pertussis cases, 2010, by month of onset
| Month | Frequency | Percentage (%) | Cumulative % |
|---|---|---|---|
| Oct 2003 | 3 | 1.9 | 1.9 |
| Nov 2003 | 1 | 0.6 | 2.5 |
| Dec 2003 | 1 | 0.6 | 3.2 |
| Jan 2004 | 2 | 1.3 | 4.4 |
| Feb 2004 | 3 | 1.9 | 6.3 |
| Mar 2004 | 2 | 1.3 | 7.6 |
| Apr 2004 | 9 | 5.7 | 13.3 |
| May 2004 | 13 | 8.2 | 21.5 |
| Jun 2004 | 38 | 24.0 | 45.6 |
| Jul 2004 | 35 | 22.2 | 67.7 |
| Aug 2004 | 18 | 11.4 | 79.1 |
| Sep 2004 | 14 | 8.9 | 88.0 |
| Oct 2004 | 8 | 5.1 | 93.0 |
| Nov 2004 | 6 | 3.8 | 96.8 |
| Dec 2004 | 5 | 3.2 | 100.0 |
| Total | 158 | 100.0 |
Interpretation. There is marked temporal clustering, suggesting that a large outbreak occurred during the summer of 2010. Note that in this dataset of cases reported during 2010 there are a number of cases with onset during 2009. Reports in 2011 should be reviewed to look for cases with onset in 2010 because of apparent delays in reporting. The magnitude of these delays can be monitored by tracking the interval between onset of disease and initial report. Figure 4 demonstrates the reported cases of pertussis in 2010 by month of onset, omitting the cases with onset in 2009, and including the few additional cases reported in 2011 but with onset in the latter months of 2010.
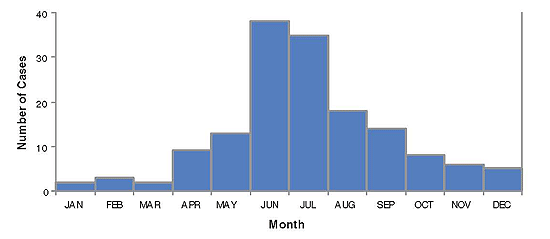
Figure 4. Reported pertussis cases by month of onset, 2010
Example 6. Pertussis cases by age group and DTaP/Tdap doses, Jan–April, 2005
| Age group | 0 DTaP/Tdap Doses | 1 DTaP/Tdap Doses | 2 DTaP/Tdap Doses | 3 DTaP/Tdap Doses | 4 DTaP/Tdap Doses | 5 DTaP/Tdap Doses | Unknown # of DTaP/Tdap Doses | Total # of DTaP/Tdap Doses |
|---|---|---|---|---|---|---|---|---|
| 0-2 mo | 7 | 1 | 0 | 0 | 0 | 0 | 0 | 8 |
| 3-4 mo | 7 | 6 | 1 | 0 | 0 | 0 | 0 | 14 |
| 5-6 mo | 2 | 6 | 1 | 0 | 0 | 0 | 1 | 10 |
| 7-18 mo | 5 | 6 | 9 | 10 | 4 | 0 | 0 | 34 |
| 19 mo–6 yr | 1 | 2 | 4 | 8 | 10 | 2 | 0 | 27 |
| 7 yrs or older | 1 | 0 | 1 | 1 | 0 | 10 | 9 | 22 |
| Total | 23 | 21 | 16 | 19 | 14 | 12 | 10 | 115 |
Interpretation. Many of the children reported with pertussis were undervaccinated. Cases among infants younger than 6 months of age are not preventable by vaccination because these infants are too young to have received three doses of pertussis vaccine, the minimum needed to confer protection. In order to be up-to-date, children 3–4 months of age should have received at least one dose; those 5–6 months, at least 2 doses; those 7–18 months, at least 3 doses; those 19 months to 3 years of age, 4 doses; and those 7 years of age and older should have received five doses. Many of these cases were among children who were not age-appropriately immunized, suggesting that there may be a wider problem with immunization coverage among young children in this community. It is often extremely difficult to verify vaccination of adults, which may account for the high proportion of cases with unknown vaccination status among children 7 years of age and older.
References
- Chen RT, Orenstein WA. Epidemiologic methods in immunization programs. Epidemiol Rev. 1996;18(2):99–117. doi: 10.1093/oxfordjournals.epirev.a01793
- CDC Update: Multistate outbreak of mumps—United States, January 1-May 2, 2006. MMWR Mob Mortal Wkly Rep 2006;55(20);559–63.