Reported Tuberculosis in the United States, 2021
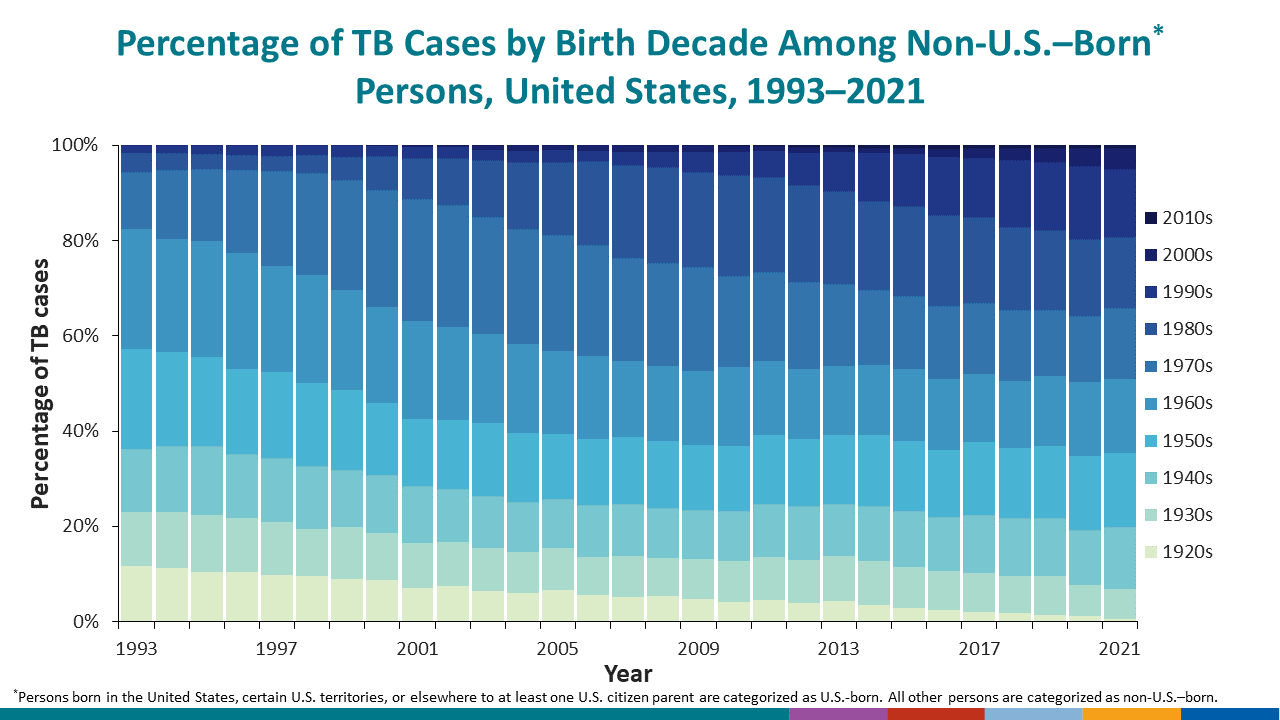
Table 9. Tuberculosis Cases and Percentages1 by Birth Decade Cohort Among Non-U.S.–Born Persons:2 United States, 1993–2021
See Surveillance Slide #35.
| Year | Total cases | 1920s | 1930s | 1940s | 1950s | 1960s | 1970s | 1980s | 1990s | 2000s | 2010s | 2020s | |||||||||||
|---|---|---|---|---|---|---|---|---|---|---|---|---|---|---|---|---|---|---|---|---|---|---|---|
| No. | (%) | No. | (%) | No. | (%) | No. | (%) | No. | (%) | No. | (%) | No. | (%) | No. | (%) | No. | (%) | No. | (%) | No. | (%) | ||
| 2021 | 5,626 | 36 | (0.6) | 346 | (6.2) | 737 | (13.1) | 878 | (15.6) | 865 | (15.4) | 842 | (15.0) | 843 | (15.0) | 800 | (14.2) | 253 | (4.5) | 24 | (0.4) | 2 | (0.0) |
| 2020 | 5,145 | 64 | (1.2) | 329 | (6.4) | 596 | (11.6) | 806 | (15.7) | 795 | (15.5) | 717 | (13.9) | 826 | (16.1) | 789 | (15.3) | 192 | (3.7) | 30 | (0.6) | 0 | (0.0) |
| 2019 | 6,371 | 93 | (1.5) | 513 | (8.1) | 783 | (12.3) | 967 | (15.2) | 936 | (14.7) | 880 | (13.8) | 1,074 | (16.9) | 903 | (14.2) | 192 | (3.0) | 29 | (0.5) | –– | –– |
| 2018 | 6,355 | 116 | (1.8) | 487 | (7.7) | 774 | (12.2) | 941 | (14.8) | 887 | (14.0) | 948 | (14.9) | 1,112 | (17.5) | 886 | (13.9) | 169 | (2.7) | 30 | (0.5) | –– | –– |
| 2017 | 6,402 | 130 | (2.0) | 525 | (8.2) | 782 | (12.2) | 975 | (15.2) | 915 | (14.3) | 954 | (14.9) | 1,141 | (17.8) | 801 | (12.5) | 132 | (2.1) | 32 | (0.5) | –– | –– |
| 2016 | 6,353 | 151 | (2.4) | 520 | (8.2) | 730 | (11.5) | 888 | (14.0) | 950 | (15.0) | 971 | (15.3) | 1,205 | (19.0) | 781 | (12.3) | 110 | (1.7) | 41 | (0.6) | –– | –– |
| 2015 | 6,407 | 183 | (2.9) | 550 | (8.6) | 751 | (11.7) | 941 | (14.7) | 964 | (15.0) | 981 | (15.3) | 1,218 | (19.0) | 698 | (10.9) | 73 | (1.1) | 35 | (0.5) | –– | –– |
| 2014 | 6,266 | 215 | (3.4) | 582 | (9.3) | 728 | (11.6) | 926 | (14.8) | 914 | (14.6) | 991 | (15.8) | 1,163 | (18.6) | 629 | (10.0) | 72 | (1.1) | 31 | (0.5) | –– | –– |
| 2013 | 6,211 | 264 | (4.3) | 591 | (9.5) | 673 | (10.8) | 895 | (14.4) | 898 | (14.5) | 1,059 | (17.1) | 1,219 | (19.6) | 506 | (8.1) | 63 | (1.0) | 16 | (0.3) | –– | –– |
| 2012 | 6,306 | 248 | (3.9) | 565 | (9.0) | 711 | (11.3) | 890 | (14.1) | 919 | (14.6) | 1,145 | (18.2) | 1,283 | (20.3) | 428 | (6.8) | 78 | (1.2) | 19 | (0.3) | –– | –– |
| 2011 | 6,554 | 293 | (4.5) | 596 | (9.1) | 722 | (11.0) | 944 | (14.4) | 1,020 | (15.6) | 1,222 | (18.6) | 1,298 | (19.8) | 361 | (5.5) | 69 | (1.1) | 4 | (0.1) | –– | –– |
| 2010 | 6,760 | 284 | (4.2) | 568 | (8.4) | 716 | (10.6) | 904 | (13.4) | 1,117 | (16.5) | 1,288 | (19.1) | 1,418 | (21.0) | 328 | (4.9) | 90 | (1.3) | 3 | (0.0) | –– | –– |
| 2009 | 6,992 | 324 | (4.6) | 585 | (8.4) | 715 | (10.2) | 947 | (13.5) | 1,084 | (15.5) | 1,518 | (21.7) | 1,389 | (19.9) | 279 | (4.0) | 101 | (1.4) | –– | –– | –– | –– |
| 2008 | 7,689 | 409 | (5.3) | 606 | (7.9) | 810 | (10.5) | 1,066 | (13.9) | 1,189 | (15.5) | 1,654 | (21.5) | 1,536 | (20.0) | 241 | (3.1) | 102 | (1.3) | –– | –– | –– | –– |
| 2007 | 7,788 | 406 | (5.2) | 652 | (8.4) | 853 | (11.0) | 1,083 | (13.9) | 1,221 | (15.7) | 1,662 | (21.3) | 1,507 | (19.4) | 219 | (2.8) | 102 | (1.3) | –– | –– | –– | –– |
| 2006 | 7,844 | 433 | (5.5) | 620 | (7.9) | 835 | (10.6) | 1,076 | (13.7) | 1,347 | (17.2) | 1,799 | (22.9) | 1,355 | (17.3) | 166 | (2.1) | 86 | (1.1) | –– | –– | –– | –– |
| 2005 | 7,737 | 509 | (6.6) | 672 | (8.7) | 783 | (10.1) | 1,036 | (13.4) | 1,330 | (17.2) | 1,839 | (23.8) | 1,173 | (15.2) | 189 | (2.4) | 73 | (0.9) | –– | –– | –– | –– |
| 2004 | 7,883 | 461 | (5.8) | 668 | (8.5) | 815 | (10.3) | 1,112 | (14.1) | 1,436 | (18.2) | 1,863 | (23.6) | 1,092 | (13.9) | 180 | (2.3) | 87 | (1.1) | –– | –– | –– | –– |
| 2003 | 7,954 | 502 | (6.3) | 709 | (8.9) | 847 | (10.6) | 1,185 | (14.9) | 1,452 | (18.3) | 1,904 | (23.9) | 943 | (11.9) | 163 | (2.0) | 69 | (0.9) | –– | –– | –– | –– |
| 2002 | 7,740 | 563 | (7.3) | 692 | (8.9) | 835 | (10.8) | 1,102 | (14.2) | 1,466 | (18.9) | 1,932 | (25.0) | 745 | (9.6) | 161 | (2.1) | 31 | (0.4) | –– | –– | –– | –– |
| 2001 | 8,042 | 544 | (6.8) | 746 | (9.3) | 918 | (11.4) | 1,102 | (13.7) | 1,598 | (19.9) | 1,979 | (24.6) | 675 | (8.4) | 182 | (2.3) | 19 | (0.2) | –– | –– | –– | –– |
| 2000 | 7,637 | 648 | (8.5) | 711 | (9.3) | 899 | (11.8) | 1,114 | (14.6) | 1,483 | (19.4) | 1,793 | (23.5) | 521 | (6.8) | 166 | (2.2) | 3 | (0.0) | –– | –– | –– | –– |
| 1999 | 7,625 | 646 | (8.5) | 800 | (10.5) | 856 | (11.2) | 1,216 | (15.9) | 1,527 | (20.0) | 1,675 | (22.0) | 339 | (4.4) | 181 | (2.4) | –– | –– | –– | –– | –– | –– |
| 1998 | 7,628 | 687 | (9.0) | 720 | (9.4) | 951 | (12.5) | 1,254 | (16.4) | 1,637 | (21.5) | 1,556 | (20.4) | 275 | (3.6) | 140 | (1.8) | –– | –– | –– | –– | –– | –– |
| 1997 | 7,759 | 704 | (9.1) | 813 | (10.5) | 970 | (12.5) | 1,301 | (16.8) | 1,611 | (20.8) | 1,442 | (18.6) | 233 | (3.0) | 160 | (2.1) | –– | –– | –– | –– | –– | –– |
| 1996 | 7,764 | 751 | (9.7) | 824 | (10.6) | 973 | (12.5) | 1,289 | (16.6) | 1,758 | (22.6) | 1,264 | (16.3) | 230 | (3.0) | 145 | (1.9) | –– | –– | –– | –– | –– | –– |
| 1995 | 8,022 | 776 | (9.7) | 875 | (10.9) | 1,083 | (13.5) | 1,371 | (17.1) | 1,804 | (22.5) | 1,115 | (13.9) | 231 | (2.9) | 135 | (1.7) | –– | –– | –– | –– | –– | –– |
| 1994 | 7,773 | 802 | (10.3) | 844 | (10.9) | 992 | (12.8) | 1,410 | (18.1) | 1,702 | (21.9) | 1,030 | (13.3) | 263 | (3.4) | 109 | (1.4) | –– | –– | –– | –– | –– | –– |
| 1993 | 7,416 | 788 | (10.6) | 764 | (10.3) | 881 | (11.9) | 1,415 | (19.1) | 1,700 | (22.9) | 800 | (10.8) | 261 | (3.5) | 112 | (1.5) | –– | –– | –– | –– | –– | –– |
1Percentages are calculated from total number of TB cases and only include percentage distributions from 1920s through 2020s.
2Persons born in the United States, certain U.S. territories, or elsewhere to at least one U.S. citizen parent are categorized as U.S.-born. All other persons are categorized as non-U.S.–born.
Note: Data for all years are updated through July 8, 2022.
Double dashes (––) indicate that data are not available.