Reported Tuberculosis in the United States, 2021
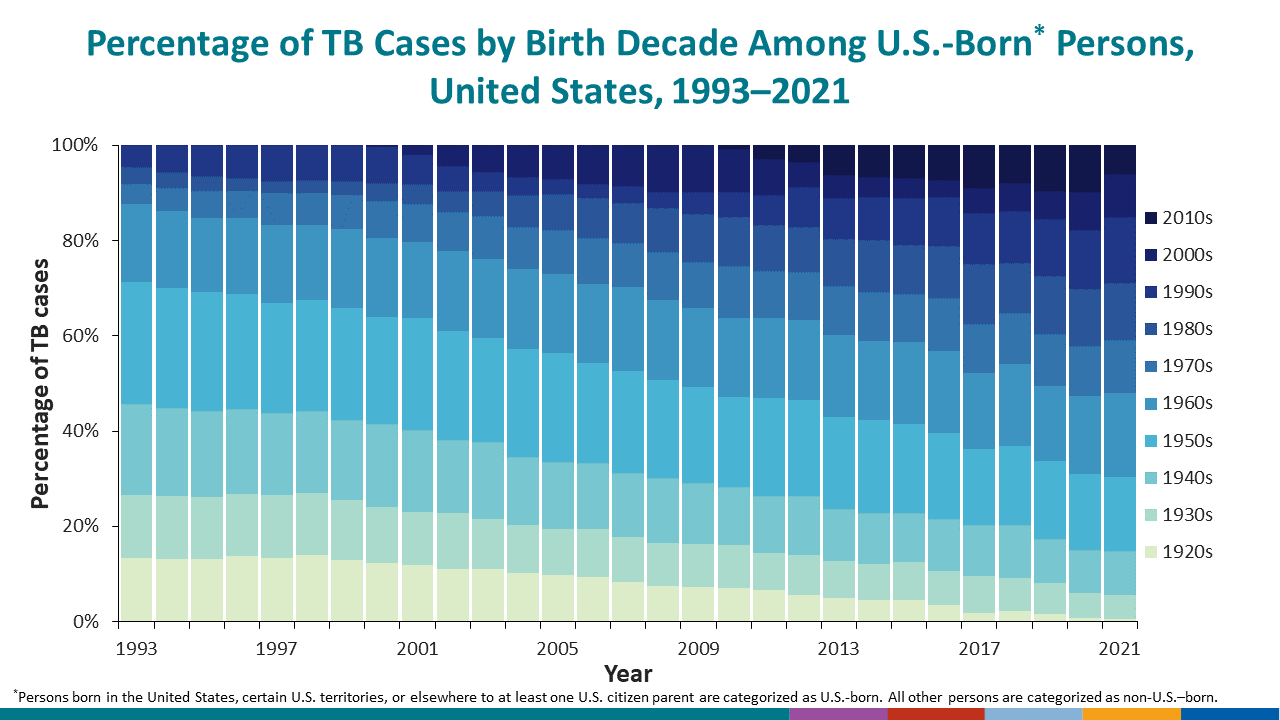
Table 8. Tuberculosis Cases and Percentages1 by Birth Decade Cohort Among U.S.-Born Persons:2 United States, 1993–2021
See Surveillance Slide #34.
| Year | Total cases | 1920s | 1930s | 1940s | 1950s | 1960s | 1970s | 1980s | 1990s | 2000s | 2010s | 2020s | |||||||||||
|---|---|---|---|---|---|---|---|---|---|---|---|---|---|---|---|---|---|---|---|---|---|---|---|
| No. | (%) | No. | (%) | No. | (%) | No. | (%) | No. | (%) | No. | (%) | No. | (%) | No. | (%) | No. | (%) | No. | (%) | No. | (%) | ||
| 2021 | 2,223 | 14 | (0.6) | 105 | (4.7) | 202 | (9.1) | 332 | (14.9) | 380 | (17.1) | 238 | (10.7) | 257 | (11.6) | 296 | (13.3) | 198 | (8.9) | 127 | (5.7) | 74 | (3.3) |
| 2020 | 2,007 | 17 | (0.8) | 104 | (5.2) | 179 | (8.9) | 320 | (15.9) | 323 | (16.1) | 213 | (10.6) | 236 | (11.8) | 249 | (12.4) | 160 | (8.0) | 193 | (9.6) | 12 | (0.6) |
| 2019 | 2,520 | 42 | (1.7) | 161 | (6.4) | 236 | (9.4) | 411 | (16.3) | 395 | (15.7) | 276 | (11.0) | 306 | (12.1) | 302 | (12.0) | 149 | (5.9) | 241 | (9.6) | –– | –– |
| 2018 | 2,640 | 57 | (2.2) | 184 | (7.0) | 297 | (11.3) | 434 | (16.4) | 453 | (17.2) | 282 | (10.7) | 277 | (10.5) | 290 | (11.0) | 153 | (5.8) | 210 | (8.0) | –– | –– |
| 2017 | 2,661 | 51 | (1.9) | 206 | (7.7) | 280 | (10.5) | 429 | (16.1) | 423 | (15.9) | 274 | (10.3) | 331 | (12.4) | 286 | (10.7) | 137 | (5.1) | 240 | (9.0) | –– | –– |
| 2016 | 2,882 | 98 | (3.4) | 209 | (7.3) | 312 | (10.8) | 523 | (18.1) | 494 | (17.1) | 319 | (11.1) | 313 | (10.9) | 299 | (10.4) | 103 | (3.6) | 208 | (7.2) | –– | –– |
| 2015 | 3,126 | 144 | (4.6) | 244 | (7.8) | 323 | (10.3) | 582 | (18.6) | 541 | (17.3) | 315 | (10.1) | 321 | (10.3) | 306 | (9.8) | 129 | (4.1) | 215 | (6.9) | –– | –– |
| 2014 | 3,110 | 141 | (4.5) | 237 | (7.6) | 327 | (10.5) | 608 | (19.5) | 511 | (16.4) | 322 | (10.4) | 335 | (10.8) | 280 | (9.0) | 131 | (4.2) | 206 | (6.6) | –– | –– |
| 2013 | 3,319 | 165 | (5.0) | 257 | (7.7) | 358 | (10.8) | 643 | (19.4) | 566 | (17.1) | 339 | (10.2) | 325 | (9.8) | 290 | (8.7) | 156 | (4.7) | 205 | (6.2) | –– | –– |
| 2012 | 3,615 | 204 | (5.6) | 300 | (8.3) | 437 | (12.1) | 723 | (20.0) | 598 | (16.5) | 364 | (10.1) | 338 | (9.3) | 303 | (8.4) | 183 | (5.1) | 125 | (3.5) | –– | –– |
| 2011 | 3,915 | 254 | (6.5) | 302 | (7.7) | 467 | (11.9) | 791 | (20.2) | 652 | (16.7) | 381 | (9.7) | 379 | (9.7) | 240 | (6.1) | 297 | (7.6) | 107 | (2.7) | –– | –– |
| 2010 | 4,303 | 305 | (7.1) | 379 | (8.8) | 516 | (12.0) | 810 | (18.8) | 707 | (16.4) | 460 | (10.7) | 444 | (10.3) | 222 | (5.2) | 384 | (8.9) | 30 | (0.7) | –– | –– |
| 2009 | 4,485 | 324 | (7.2) | 394 | (8.8) | 574 | (12.8) | 889 | (19.8) | 729 | (16.3) | 427 | (9.5) | 453 | (10.1) | 202 | (4.5) | 430 | (9.6) | –– | –– | –– | –– |
| 2008 | 5,245 | 383 | (7.3) | 469 | (8.9) | 694 | (13.2) | 1,059 | (20.2) | 867 | (16.5) | 510 | (9.7) | 472 | (9.0) | 180 | (3.4) | 498 | (9.5) | –– | –– | –– | –– |
| 2007 | 5,426 | 440 | (8.1) | 498 | (9.2) | 713 | (13.1) | 1,132 | (20.9) | 935 | (17.2) | 491 | (9.0) | 449 | (8.3) | 188 | (3.5) | 449 | (8.3) | –– | –– | –– | –– |
| 2006 | 5,852 | 533 | (9.1) | 571 | (9.8) | 794 | (13.6) | 1,187 | (20.3) | 947 | (16.2) | 554 | (9.5) | 473 | (8.1) | 167 | (2.9) | 460 | (7.9) | –– | –– | –– | –– |
| 2005 | 6,286 | 591 | (9.4) | 588 | (9.4) | 852 | (13.6) | 1,375 | (21.9) | 1,007 | (16.0) | 564 | (9.0) | 449 | (7.1) | 195 | (3.1) | 423 | (6.7) | –– | –– | –– | –– |
| 2004 | 6,592 | 648 | (9.8) | 621 | (9.4) | 898 | (13.6) | 1,433 | (21.7) | 1,050 | (15.9) | 552 | (8.4) | 423 | (6.4) | 238 | (3.6) | 417 | (6.3) | –– | –– | –– | –– |
| 2003 | 6,832 | 708 | (10.4) | 684 | (10.0) | 1,033 | (15.1) | 1,412 | (20.7) | 1,072 | (15.7) | 571 | (8.4) | 350 | (5.1) | 257 | (3.8) | 352 | (5.2) | –– | –– | –– | –– |
| 2002 | 7,259 | 755 | (10.4) | 794 | (10.9) | 1,043 | (14.4) | 1,541 | (21.2) | 1,143 | (15.7) | 551 | (7.6) | 309 | (4.3) | 353 | (4.9) | 288 | (4.0) | –– | –– | –– | –– |
| 2001 | 7,838 | 858 | (10.9) | 824 | (10.5) | 1,247 | (15.9) | 1,713 | (21.9) | 1,151 | (14.7) | 588 | (7.5) | 299 | (3.8) | 439 | (5.6) | 150 | (1.9) | –– | –– | –– | –– |
| 2000 | 8,627 | 965 | (11.2) | 940 | (10.9) | 1,370 | (15.9) | 1,776 | (20.6) | 1,309 | (15.2) | 611 | (7.1) | 299 | (3.5) | 588 | (6.8) | 29 | (0.3) | –– | –– | –– | –– |
| 1999 | 9,776 | 1,140 | (11.7) | 1,088 | (11.1) | 1,483 | (15.2) | 2,060 | (21.1) | 1,442 | (14.8) | 628 | (6.4) | 267 | (2.7) | 645 | (6.6) | –– | –– | –– | –– | –– | –– |
| 1998 | 10,606 | 1,304 | (12.3) | 1,214 | (11.4) | 1,619 | (15.3) | 2,178 | (20.5) | 1,482 | (14.0) | 618 | (5.8) | 262 | (2.5) | 673 | (6.3) | –– | –– | –– | –– | –– | –– |
| 1997 | 11,920 | 1,389 | (11.7) | 1,389 | (11.7) | 1,783 | (15.0) | 2,422 | (20.3) | 1,691 | (14.2) | 702 | (5.9) | 277 | (2.3) | 767 | (6.4) | –– | –– | –– | –– | –– | –– |
| 1996 | 13,375 | 1,603 | (12.0) | 1,490 | (11.1) | 2,059 | (15.4) | 2,810 | (21.0) | 1,834 | (13.7) | 671 | (5.0) | 316 | (2.4) | 779 | (5.8) | –– | –– | –– | –– | –– | –– |
| 1995 | 14,652 | 1,634 | (11.2) | 1,637 | (11.2) | 2,259 | (15.4) | 3,118 | (21.3) | 1,967 | (13.4) | 700 | (4.8) | 383 | (2.6) | 812 | (5.5) | –– | –– | –– | –– | –– | –– |
| 1994 | 16,170 | 1,827 | (11.3) | 1,826 | (11.3) | 2,544 | (15.7) | 3,489 | (21.6) | 2,238 | (13.8) | 678 | (4.2) | 453 | (2.8) | 777 | (4.8) | –– | –– | –– | –– | –– | –– |
| 1993 | 17,423 | 1,952 | (11.2) | 1,947 | (11.2) | 2,816 | (16.2) | 3,749 | (21.5) | 2,409 | (13.8) | 636 | (3.7) | 521 | (3.0) | 658 | (3.8) | –– | –– | –– | –– | –– | –– |
1Percentages are calculated from total number of TB cases and only include percentage distributions from the 1920s through 2020s.
2Persons born in the United States, certain U.S. territories, or elsewhere to at least one U.S. citizen parent are categorized as U.S.-born. All other persons are categorized as non-U.S.–born.
Note: Data for all years are updated through July 8, 2022.
Double dashes (––) indicate that data are not available.