Reported Tuberculosis in the United States, 2021
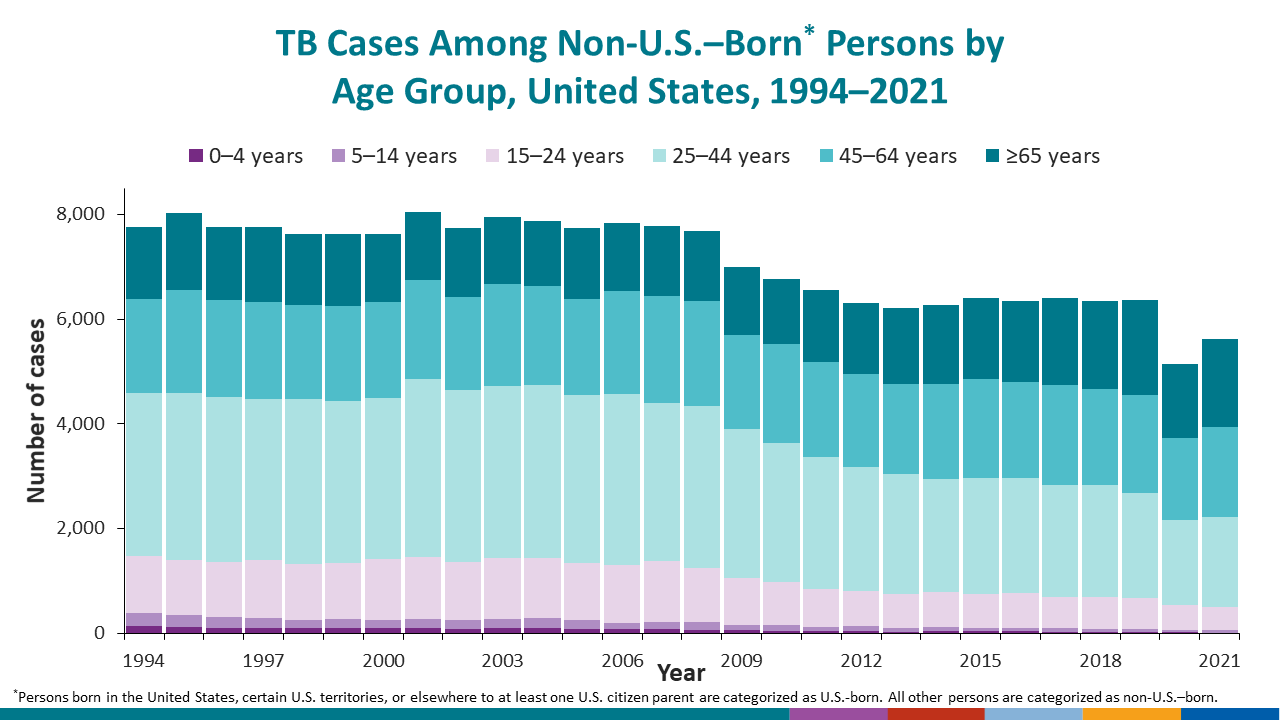
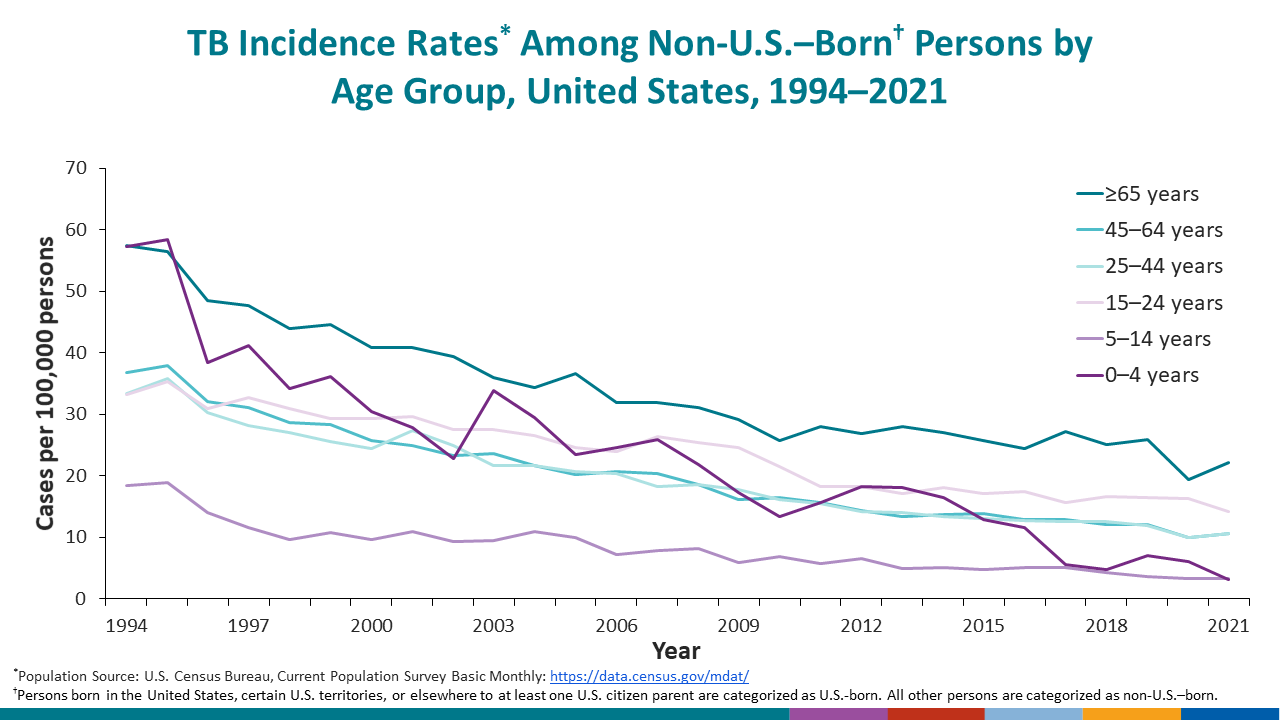
Table 7. Tuberculosis Cases, Percentages, and Incidence Rates per 100,000 Population Among Non-U.S.–Born Persons1 by Age Group: United States, 1993–2021
See Surveillance Slides #32, #33, #37 and #38.
| Year | Total cases | 0─4 | 5─14 | 15─24 | 25─44 | 45─64 | ≥65 | Unknown or missing | |||||||||||||
|---|---|---|---|---|---|---|---|---|---|---|---|---|---|---|---|---|---|---|---|---|---|
| No. | (%) | Rate | No. | (%) | Rate | No. | (%) | Rate | No. | (%) | Rate | No. | (%) | Rate | No. | (%) | Rate | No. | (%) | ||
| 2021 | 5,626 | 7 | (0.1) | 3.2 | 55 | (1.0) | 3.3 | 441 | (7.8) | 14.2 | 1,718 | (30.5) | 10.6 | 1,720 | (30.6) | 10.6 | 1,685 | (30.0) | 22.2 | 0 | (0.0) |
| 2020 | 5,145 | 13 | (0.3) | 6.0 | 49 | (1.0) | 3.3 | 477 | (9.3) | 16.3 | 1,624 | (31.6) | 10.0 | 1,568 | (30.5) | 10.0 | 1,414 | (27.5) | 19.5 | 0 | (0.0) |
| 2019 | 6,371 | 18 | (0.3) | 7.1 | 54 | (0.8) | 3.6 | 595 | (9.3) | 16.5 | 2,011 | (31.6) | 12.0 | 1,878 | (29.5) | 12.0 | 1,815 | (28.5) | 26.0 | 0 | (0.0) |
| 2018 | 6,355 | 17 | (0.3) | 4.7 | 66 | (1.0) | 4.3 | 613 | (9.6) | 16.6 | 2,141 | (33.7) | 12.6 | 1,830 | (28.8) | 12.1 | 1,688 | (26.6) | 25.1 | 0 | (0.0) |
| 2017 | 6,402 | 21 | (0.3) | 5.6 | 74 | (1.2) | 5.2 | 590 | (9.2) | 15.6 | 2,147 | (33.5) | 12.6 | 1,903 | (29.7) | 13.0 | 1,665 | (26.0) | 27.2 | 2 | (0.0) |
| 2016 | 6,353 | 33 | (0.5) | 11.6 | 68 | (1.1) | 5.1 | 658 | (10.4) | 17.5 | 2,207 | (34.7) | 12.8 | 1,838 | (28.9) | 12.9 | 1,549 | (24.4) | 24.5 | 0 | (0.0) |
| 2015 | 6,407 | 34 | (0.5) | 12.9 | 66 | (1.0) | 4.9 | 649 | (10.1) | 17.2 | 2,219 | (34.6) | 13.1 | 1,893 | (29.5) | 13.8 | 1,546 | (24.1) | 25.8 | 0 | (0.0) |
| 2014 | 6,266 | 39 | (0.6) | 16.5 | 72 | (1.1) | 5.2 | 669 | (10.7) | 18.1 | 2,164 | (34.5) | 13.3 | 1,826 | (29.1) | 13.8 | 1,496 | (23.9) | 27.0 | 0 | (0.0) |
| 2013 | 6,211 | 32 | (0.5) | 18.1 | 68 | (1.1) | 4.9 | 656 | (10.6) | 17.1 | 2,279 | (36.7) | 14.1 | 1,731 | (27.9) | 13.4 | 1,445 | (23.3) | 28.1 | 0 | (0.0) |
| 2012 | 6,306 | 43 | (0.7) | 18.3 | 94 | (1.5) | 6.5 | 674 | (10.7) | 18.2 | 2,374 | (37.6) | 14.2 | 1,774 | (28.1) | 14.4 | 1,346 | (21.3) | 26.9 | 1 | (0.0) |
| 2011 | 6,554 | 33 | (0.5) | 15.7 | 88 | (1.3) | 5.8 | 716 | (10.9) | 18.3 | 2,522 | (38.5) | 15.5 | 1,823 | (27.8) | 15.6 | 1,372 | (20.9) | 28.0 | 0 | (0.0) |
| 2010 | 6,760 | 41 | (0.6) | 13.4 | 114 | (1.7) | 7.0 | 827 | (12.2) | 21.6 | 2,660 | (39.3) | 16.2 | 1,881 | (27.8) | 16.5 | 1,237 | (18.3) | 25.8 | 0 | (0.0) |
| 2009 | 6,992 | 52 | (0.7) | 17.2 | 95 | (1.4) | 6.0 | 900 | (12.9) | 24.6 | 2,864 | (41.0) | 17.7 | 1,792 | (25.6) | 16.1 | 1,289 | (18.4) | 29.1 | 0 | (0.0) |
| 2008 | 7,689 | 64 | (0.8) | 21.8 | 141 | (1.8) | 8.2 | 1,046 | (13.6) | 25.4 | 3,090 | (40.2) | 18.6 | 2,007 | (26.1) | 18.6 | 1,341 | (17.4) | 31.1 | 0 | (0.0) |
| 2007 | 7,788 | 72 | (0.9) | 25.8 | 134 | (1.7) | 7.8 | 1,165 | (15.0) | 26.4 | 3,023 | (38.8) | 18.2 | 2,048 | (26.3) | 20.4 | 1,346 | (17.3) | 32.0 | 0 | (0.0) |
| 2006 | 7,844 | 73 | (0.9) | 24.6 | 130 | (1.7) | 7.2 | 1,107 | (14.1) | 24.0 | 3,264 | (41.6) | 20.4 | 1,968 | (25.1) | 20.8 | 1,301 | (16.6) | 32.0 | 1 | (0.0) |
| 2005 | 7,737 | 73 | (0.9) | 23.5 | 170 | (2.2) | 10.0 | 1,103 | (14.3) | 24.6 | 3,198 | (41.3) | 20.8 | 1,851 | (23.9) | 20.2 | 1,342 | (17.3) | 36.7 | 0 | (0.0) |
| 2004 | 7,883 | 101 | (1.3) | 29.6 | 182 | (2.3) | 10.9 | 1,163 | (14.8) | 26.6 | 3,294 | (41.8) | 21.7 | 1,898 | (24.1) | 21.7 | 1,244 | (15.8) | 34.4 | 1 | (0.0) |
| 2003 | 7,954 | 101 | (1.3) | 33.9 | 168 | (2.1) | 9.5 | 1,168 | (14.7) | 27.5 | 3,289 | (41.4) | 21.7 | 1,947 | (24.5) | 23.6 | 1,281 | (16.1) | 35.9 | 0 | (0.0) |
| 2002 | 7,740 | 83 | (1.1) | 22.9 | 166 | (2.1) | 9.4 | 1,113 | (14.4) | 27.6 | 3,284 | (42.4) | 25.0 | 1,788 | (23.1) | 23.3 | 1,305 | (16.9) | 39.4 | 1 | (0.0) |
| 2001 | 8,042 | 99 | (1.2) | 27.8 | 173 | (2.2) | 10.9 | 1,183 | (14.7) | 29.6 | 3,405 | (42.3) | 27.4 | 1,883 | (23.4) | 25.0 | 1,298 | (16.1) | 41.0 | 1 | (0.0) |
| 2000 | 7,637 | 90 | (1.2) | 30.4 | 168 | (2.2) | 9.6 | 1,155 | (15.1) | 29.4 | 3,078 | (40.3) | 24.5 | 1,844 | (24.1) | 25.8 | 1,302 | (17.0) | 40.9 | 0 | (0.0) |
| 1999 | 7,625 | 94 | (1.2) | 36.2 | 176 | (2.3) | 10.9 | 1,064 | (14.0) | 29.3 | 3,095 | (40.6) | 25.7 | 1,823 | (23.9) | 28.3 | 1,373 | (18.0) | 44.6 | 0 | (0.0) |
| 1998 | 7,628 | 93 | (1.2) | 34.2 | 161 | (2.1) | 9.7 | 1,072 | (14.1) | 30.9 | 3,146 | (41.2) | 27.0 | 1,793 | (23.5) | 28.6 | 1,363 | (17.9) | 44.0 | 0 | (0.0) |
| 1997 | 7,759 | 104 | (1.3) | 41.1 | 184 | (2.4) | 11.7 | 1,105 | (14.2) | 32.7 | 3,078 | (39.7) | 28.1 | 1,854 | (23.9) | 31.1 | 1,433 | (18.5) | 47.8 | 1 | (0.0) |
| 1996 | 7,764 | 102 | (1.3) | 38.4 | 212 | (2.7) | 14.1 | 1,051 | (13.5) | 31.0 | 3,154 | (40.6) | 30.3 | 1,840 | (23.7) | 32.1 | 1,403 | (18.1) | 48.5 | 2 | (0.0) |
| 1995 | 8,022 | 126 | (1.6) | 58.4 | 228 | (2.8) | 18.9 | 1,038 | (12.9) | 35.4 | 3,199 | (39.9) | 35.8 | 1,967 | (24.5) | 37.9 | 1,463 | (18.2) | 56.5 | 1 | (0.0) |
| 1994 | 7,773 | 133 | (1.7) | 57.3 | 257 | (3.3) | 18.4 | 1,093 | (14.1) | 33.2 | 3,106 | (40.0) | 33.4 | 1,805 | (23.2) | 36.8 | 1,378 | (17.7) | 57.5 | 1 | (0.0) |
| 1993 | 7,416 | 170 | (2.3) | –– | 243 | (3.3) | –– | 1,015 | (13.7) | –– | 3,034 | (40.9) | –– | 1,596 | (21.5) | –– | 1,356 | (18.3) | –– | 2 | (0.0) |
1Persons born in the United States, certain U.S. territories, or elsewhere to at least one U.S. citizen parent are categorized as U.S.-born. All other persons are categorized as non-U.S.–born.
Note: Incidence rates were created using Current Population Survey (CPS) Basic Monthly data set, obtained from https://data.census.gov/mdat/#/. The CPS does not include institutionalized persons.
Data for all years are updated through July 8, 2022.
Double dashes (––) indicate that data not available.
Zero % (0.0) denotes <0.05%.
See Technical Notes.