Reported Tuberculosis in the United States, 2021
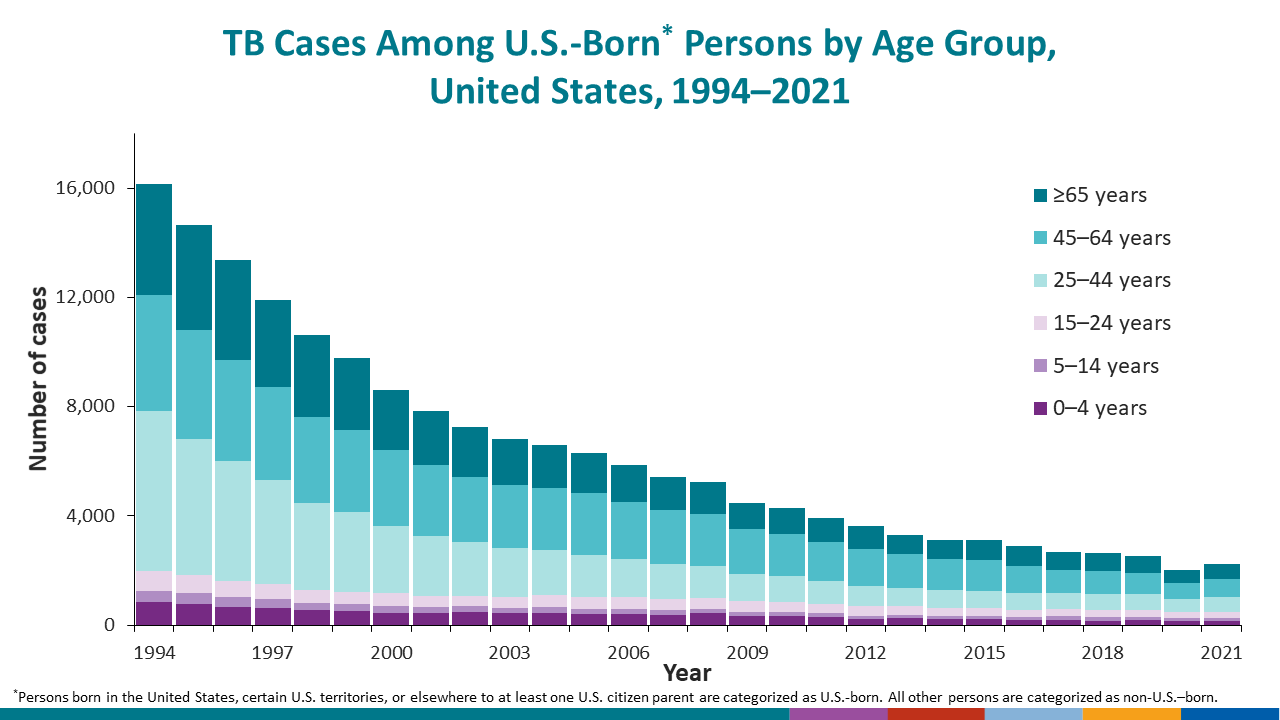
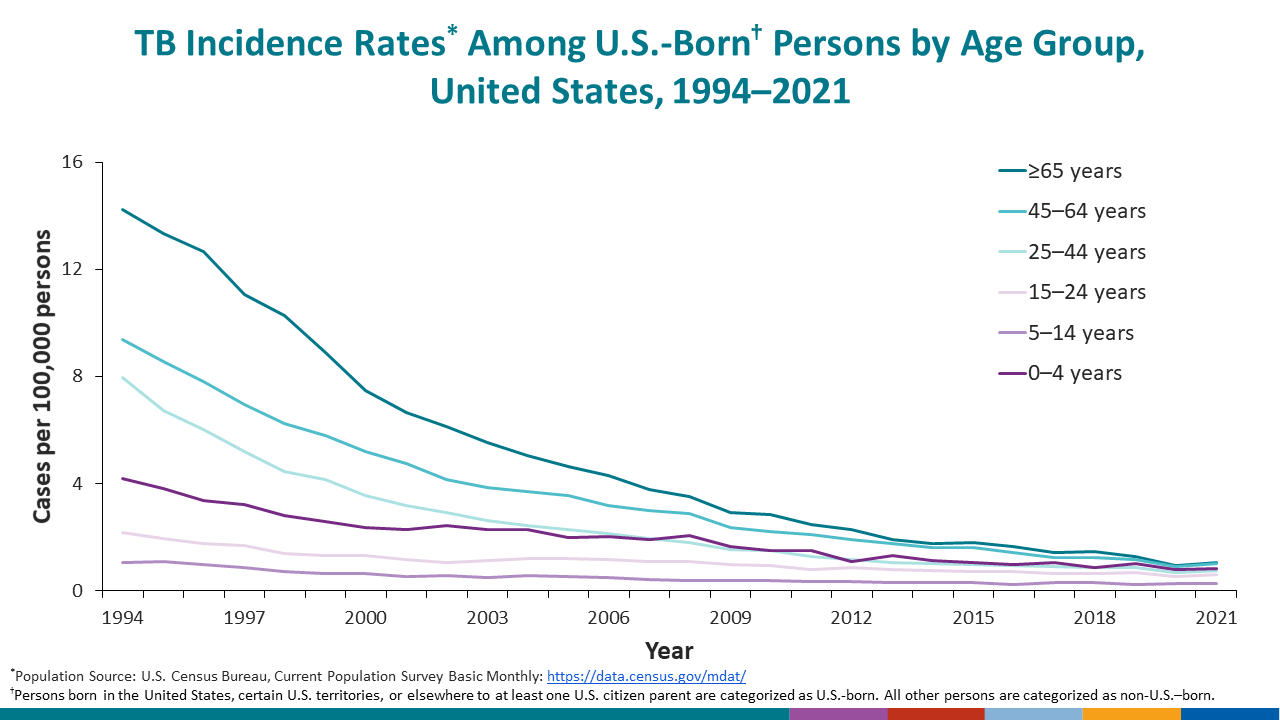
Table 6. Tuberculosis Cases, Percentages, and Incidence Rates per 100,000 Population Among U.S.-Born Persons1 by Age Group: United States, 1993–2021
See Surveillance Slides #30, #31, #37 and #38.
| Year | Total cases | 0─4 | 5─14 | 15─24 | 25─44 | 45─64 | ≥65 | Unknown or missing | |||||||||||||
|---|---|---|---|---|---|---|---|---|---|---|---|---|---|---|---|---|---|---|---|---|---|
| No. | (%) | Rate | No. | (%) | Rate | No. | (%) | Rate | No. | (%) | Rate | No. | (%) | Rate | No. | (%) | Rate | No. | (%) | ||
| 2021 | 2,223 | 153 | (6.9) | 0.8 | 102 | (4.6) | 0.3 | 234 | (10.5) | 0.6 | 545 | (24.5) | 0.8 | 670 | (30.1) | 1.0 | 519 | (23.3) | 1.1 | 0 | (0.0) |
| 2020 | 2,007 | 152 | (7.6) | 0.8 | 103 | (5.1) | 0.3 | 213 | (10.6) | 0.6 | 483 | (24.1) | 0.7 | 603 | (30.0) | 0.9 | 453 | (22.6) | 1.0 | 0 | (0.0) |
| 2019 | 2,520 | 197 | (7.8) | 1.0 | 96 | (3.8) | 0.2 | 255 | (10.1) | 0.7 | 600 | (23.8) | 0.9 | 778 | (30.9) | 1.2 | 594 | (23.6) | 1.3 | 0 | (0.0) |
| 2018 | 2,640 | 167 | (6.3) | 0.9 | 122 | (4.6) | 0.3 | 255 | (9.7) | 0.7 | 581 | (22.0) | 0.9 | 857 | (32.5) | 1.3 | 657 | (24.9) | 1.5 | 1 | (0.0) |
| 2017 | 2,661 | 206 | (7.7) | 1.1 | 128 | (4.8) | 0.3 | 253 | (9.5) | 0.7 | 603 | (22.7) | 0.9 | 846 | (31.8) | 1.2 | 625 | (23.5) | 1.4 | 0 | (0.0) |
| 2016 | 2,882 | 190 | (6.6) | 1.0 | 95 | (3.3) | 0.2 | 276 | (9.6) | 0.7 | 620 | (21.5) | 0.9 | 1,002 | (34.8) | 1.4 | 698 | (24.2) | 1.7 | 1 | (0.0) |
| 2015 | 3,126 | 210 | (6.7) | 1.1 | 130 | (4.2) | 0.3 | 287 | (9.2) | 0.7 | 639 | (20.4) | 1.0 | 1,125 | (36.0) | 1.6 | 735 | (23.5) | 1.8 | 0 | (0.0) |
| 2014 | 3,110 | 224 | (7.2) | 1.1 | 123 | (4.0) | 0.3 | 290 | (9.3) | 0.7 | 657 | (21.1) | 1.0 | 1,124 | (36.1) | 1.6 | 692 | (22.3) | 1.8 | 0 | (0.0) |
| 2013 | 3,319 | 262 | (7.9) | 1.3 | 120 | (3.6) | 0.3 | 318 | (9.6) | 0.8 | 678 | (20.4) | 1.0 | 1,215 | (36.6) | 1.8 | 726 | (21.9) | 1.9 | 0 | (0.0) |
| 2012 | 3,615 | 218 | (6.0) | 1.1 | 132 | (3.7) | 0.3 | 345 | (9.5) | 0.9 | 744 | (20.6) | 1.2 | 1,335 | (36.9) | 1.9 | 841 | (23.3) | 2.3 | 0 | (0.0) |
| 2011 | 3,915 | 317 | (8.1) | 1.5 | 138 | (3.5) | 0.3 | 311 | (7.9) | 0.8 | 834 | (21.3) | 1.3 | 1,453 | (37.1) | 2.1 | 862 | (22.0) | 2.5 | 0 | (0.0) |
| 2010 | 4,303 | 321 | (7.5) | 1.5 | 156 | (3.6) | 0.4 | 357 | (8.3) | 0.9 | 976 | (22.7) | 1.5 | 1,529 | (35.5) | 2.2 | 964 | (22.4) | 2.8 | 0 | (0.0) |
| 2009 | 4,485 | 351 | (7.8) | 1.7 | 149 | (3.3) | 0.4 | 375 | (8.4) | 1.0 | 1,014 | (22.6) | 1.6 | 1,615 | (36.0) | 2.4 | 981 | (21.9) | 2.9 | 0 | (0.0) |
| 2008 | 5,245 | 428 | (8.2) | 2.1 | 148 | (2.8) | 0.4 | 407 | (7.8) | 1.1 | 1,168 | (22.3) | 1.8 | 1,933 | (36.9) | 2.9 | 1,161 | (22.1) | 3.5 | 0 | (0.0) |
| 2007 | 5,426 | 390 | (7.2) | 1.9 | 169 | (3.1) | 0.4 | 407 | (7.5) | 1.1 | 1,269 | (23.4) | 1.9 | 1,975 | (36.4) | 3.0 | 1,215 | (22.4) | 3.8 | 1 | (0.0) |
| 2006 | 5,852 | 409 | (7.0) | 2.0 | 191 | (3.3) | 0.5 | 423 | (7.2) | 1.2 | 1,414 | (24.2) | 2.1 | 2,058 | (35.2) | 3.2 | 1,357 | (23.2) | 4.3 | 0 | (0.0) |
| 2005 | 6,286 | 401 | (6.4) | 2.0 | 205 | (3.3) | 0.5 | 434 | (6.9) | 1.2 | 1,530 | (24.3) | 2.3 | 2,259 | (35.9) | 3.6 | 1,457 | (23.2) | 4.6 | 0 | (0.0) |
| 2004 | 6,592 | 448 | (6.8) | 2.3 | 220 | (3.3) | 0.6 | 440 | (6.7) | 1.2 | 1,639 | (24.9) | 2.4 | 2,283 | (34.6) | 3.7 | 1,562 | (23.7) | 5.0 | 0 | (0.0) |
| 2003 | 6,832 | 445 | (6.5) | 2.3 | 196 | (2.9) | 0.5 | 403 | (5.9) | 1.1 | 1,764 | (25.8) | 2.6 | 2,325 | (34.0) | 3.9 | 1,699 | (24.9) | 5.5 | 0 | (0.0) |
| 2002 | 7,259 | 470 | (6.5) | 2.4 | 218 | (3.0) | 0.6 | 380 | (5.2) | 1.1 | 1,987 | (27.4) | 2.9 | 2,380 | (32.8) | 4.2 | 1,824 | (25.1) | 6.2 | 0 | (0.0) |
| 2001 | 7,838 | 442 | (5.6) | 2.3 | 210 | (2.7) | 0.5 | 411 | (5.2) | 1.2 | 2,189 | (27.9) | 3.2 | 2,617 | (33.4) | 4.8 | 1,969 | (25.1) | 6.6 | 0 | (0.0) |
| 2000 | 8,627 | 453 | (5.3) | 2.3 | 251 | (2.9) | 0.6 | 460 | (5.3) | 1.3 | 2,477 | (28.7) | 3.6 | 2,781 | (32.2) | 5.2 | 2,205 | (25.6) | 7.5 | 0 | (0.0) |
| 1999 | 9,776 | 503 | (5.1) | 2.6 | 254 | (2.6) | 0.7 | 447 | (4.6) | 1.3 | 2,939 | (30.1) | 4.2 | 3,014 | (30.8) | 5.8 | 2,617 | (26.8) | 8.9 | 2 | (0.0) |
| 1998 | 10,606 | 541 | (5.1) | 2.8 | 276 | (2.6) | 0.7 | 466 | (4.4) | 1.4 | 3,177 | (30.0) | 4.4 | 3,149 | (29.7) | 6.3 | 2,997 | (28.3) | 10.3 | 0 | (0.0) |
| 1997 | 11,920 | 628 | (5.3) | 3.2 | 331 | (2.8) | 0.9 | 563 | (4.7) | 1.7 | 3,783 | (31.7) | 5.2 | 3,410 | (28.6) | 7.0 | 3,205 | (26.9) | 11.1 | 0 | (0.0) |
| 1996 | 13,375 | 666 | (5.0) | 3.4 | 373 | (2.8) | 1.0 | 581 | (4.3) | 1.8 | 4,390 | (32.8) | 6.0 | 3,714 | (27.8) | 7.8 | 3,648 | (27.3) | 12.7 | 3 | (0.0) |
| 1995 | 14,652 | 767 | (5.2) | 3.8 | 413 | (2.8) | 1.1 | 656 | (4.5) | 2.0 | 4,986 | (34.0) | 6.7 | 3,977 | (27.1) | 8.6 | 3,849 | (26.3) | 13.3 | 4 | (0.0) |
| 1994 | 16,170 | 847 | (5.2) | 4.2 | 401 | (2.5) | 1.1 | 720 | (4.5) | 2.2 | 5,859 | (36.2) | 8.0 | 4,261 | (26.4) | 9.4 | 4,077 | (25.2) | 14.2 | 5 | (0.0) |
| 1993 | 17,423 | 834 | (4.8) | –– | 397 | (2.3) | –– | 790 | (4.5) | –– | 6,475 | (37.2) | –– | 4,526 | (26.0) | –– | 4,386 | (25.2) | –– | 15 | (0.1) |
1Persons born in the United States, certain U.S. territories, or elsewhere to at least one U.S. citizen parent are categorized as U.S.-born. All other persons are categorized as non-U.S.–born.
Note: Incidence rates were created using Current Population Survey (CPS) Basic Monthly data set, obtained from https://data.census.gov/mdat/#/. The CPS does not include institutionalized persons.
Data for all years are updated through July 8, 2022.
Double dashes (––) indicate that data are not available.
Zero % (0.0) denotes <0.05%.
See Technical Notes.