Reported Tuberculosis in the United States, 2021
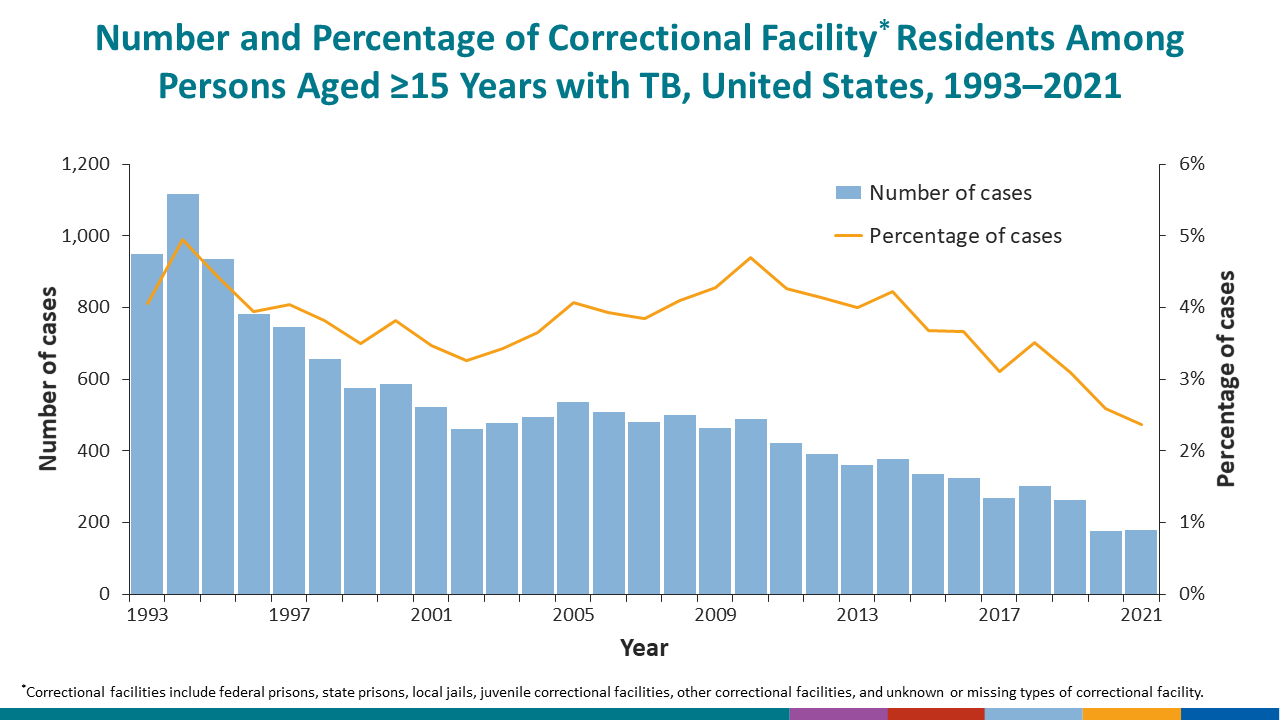
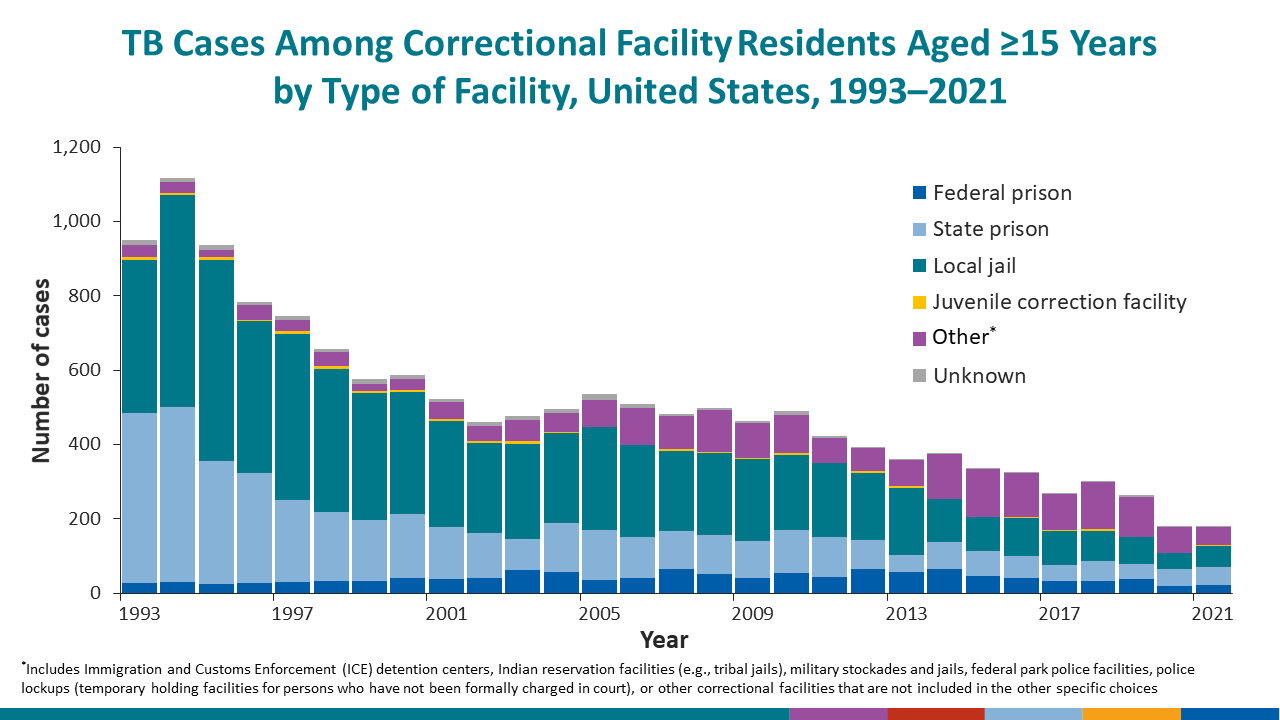
Table 29. Tuberculosis Cases and Percentages by Residence in and Type of Correctional Facility, Ages ≥15 Years: United States, 1993–2021
See Surveillance Slides #53 and #54.
| Year | Total cases1 | Federal prison | State prison | Local jail | Juvenile facility | Other type of facility2 | Unknown or missing | ||||||
|---|---|---|---|---|---|---|---|---|---|---|---|---|---|
| No. | (%) | No. | (%) | No. | (%) | No. | (%) | No. | (%) | No. | (%) | ||
| 2021 | 7,565 | 22 | (12.3) | 50 | (27.9) | 56 | (31.3) | 1 | (0.6) | 49 | (27.4) | 1 | (0.6) |
| 2020 | 6,854 | 19 | (10.7) | 47 | (26.4) | 41 | (23.0) | 2 | (1.1) | 68 | (38.2) | 1 | (0.6) |
| 2019 | 8,533 | 38 | (14.4) | 41 | (15.5) | 72 | (27.3) | 0 | 0 | 109 | (41.3) | 4 | (1.5) |
| 2018 | 8,625 | 33 | (10.9) | 54 | (17.8) | 80 | (26.4) | 5 | (1.7) | 127 | (41.9) | 4 | (1.3) |
| 2017 | 8,637 | 34 | (12.6) | 41 | (15.2) | 92 | (34.2) | 2 | (0.7) | 99 | (36.8) | 1 | (0.4) |
| 2016 | 8,853 | 41 | (12.7) | 58 | (17.9) | 103 | (31.8) | 2 | (0.6) | 119 | (36.7) | 1 | (0.3) |
| 2015 | 9,098 | 46 | (13.7) | 67 | (20.0) | 92 | (27.5) | 1 | (0.3) | 127 | (37.9) | 2 | (0.6) |
| 2014 | 8,924 | 64 | (17.0) | 74 | (19.6) | 116 | (30.8) | 0 | 0 | 120 | (31.8) | 3 | (0.8) |
| 2013 | 9,057 | 57 | (15.7) | 46 | (12.7) | 180 | (49.7) | 6 | (1.7) | 69 | (19.1) | 4 | (1.1) |
| 2012 | 9,435 | 66 | (16.9) | 78 | (19.9) | 180 | (46.0) | 4 | (1.0) | 62 | (15.9) | 1 | (0.3) |
| 2011 | 9,898 | 45 | (10.7) | 107 | (25.4) | 198 | (46.9) | 0 | 0 | 68 | (16.1) | 4 | (0.9) |
| 2010 | 10,439 | 55 | (11.2) | 116 | (23.7) | 202 | (41.2) | 5 | (1.0) | 101 | (20.6) | 11 | (2.2) |
| 2009 | 10,847 | 42 | (9.1) | 99 | (21.3) | 219 | (47.2) | 4 | (0.9) | 95 | (20.5) | 5 | (1.1) |
| 2008 | 12,162 | 51 | (10.2) | 107 | (21.4) | 218 | (43.7) | 3 | (0.6) | 115 | (23.0) | 5 | (1.0) |
| 2007 | 12,507 | 64 | (13.3) | 103 | (21.4) | 216 | (44.9) | 4 | (0.8) | 89 | (18.5) | 5 | (1.0) |
| 2006 | 12,916 | 42 | (8.3) | 109 | (21.5) | 249 | (49.0) | 0 | 0 | 99 | (19.5) | 9 | (1.8) |
| 2005 | 13,203 | 35 | (6.5) | 134 | (25.0) | 277 | (51.6) | 2 | (0.4) | 71 | (13.2) | 18 | (3.4) |
| 2004 | 13,545 | 58 | (11.7) | 130 | (26.3) | 242 | (48.9) | 4 | (0.8) | 50 | (10.1) | 11 | (2.2) |
| 2003 | 13,922 | 63 | (13.2) | 84 | (17.6) | 255 | (53.5) | 7 | (1.5) | 58 | (12.2) | 10 | (2.1) |
| 2002 | 14,111 | 41 | (8.9) | 122 | (26.5) | 242 | (52.6) | 5 | (1.1) | 39 | (8.5) | 11 | (2.4) |
| 2001 | 15,017 | 38 | (7.3) | 141 | (27.0) | 283 | (54.2) | 8 | (1.5) | 44 | (8.4) | 8 | (1.5) |
| 2000 | 15,342 | 40 | (6.8) | 174 | (29.6) | 327 | (55.7) | 5 | (0.9) | 30 | (5.1) | 11 | (1.9) |
| 1999 | 16,453 | 33 | (5.7) | 163 | (28.3) | 343 | (59.5) | 4 | (0.7) | 20 | (3.5) | 13 | (2.3) |
| 1998 | 17,211 | 32 | (4.9) | 187 | (28.5) | 383 | (58.3) | 8 | (1.2) | 39 | (5.9) | 8 | (1.2) |
| 1997 | 18,501 | 30 | (4.0) | 220 | (29.5) | 446 | (59.7) | 9 | (1.2) | 30 | (4.0) | 12 | (1.6) |
| 1996 | 19,851 | 28 | (3.6) | 295 | (37.7) | 409 | (52.3) | 4 | (0.5) | 40 | (5.1) | 6 | (0.8) |
| 1995 | 21,186 | 24 | (2.6) | 331 | (35.3) | 540 | (57.6) | 8 | (0.9) | 21 | (2.2) | 13 | (1.4) |
| 1994 | 22,542 | 31 | (2.8) | 470 | (42.1) | 571 | (51.1) | 4 | (0.4) | 30 | (2.7) | 11 | (1.0) |
| 1993 | 23,428 | 28 | (2.9) | 457 | (48.1) | 410 | (43.2) | 10 | (1.1) | 31 | (3.3) | 14 | (1.5) |
1Persons ≥15 years of age.
2Includes Immigration and Customs Enforcement (ICE) detention centers, Indian reservation facilities (e.g., tribal jails), military stockades and jails, federal park police facilities, police lockups (temporary holding facilities for persons who have not been formally charged in court), or other correctional facilities that are not included in the other specific choices.