Reported Tuberculosis in the United States, 2021
Table 27. Tuberculosis Cases and Incidence Rates per 100,000 Population by Origin of Birth,1 Sex, and Age Group: United States, 2021
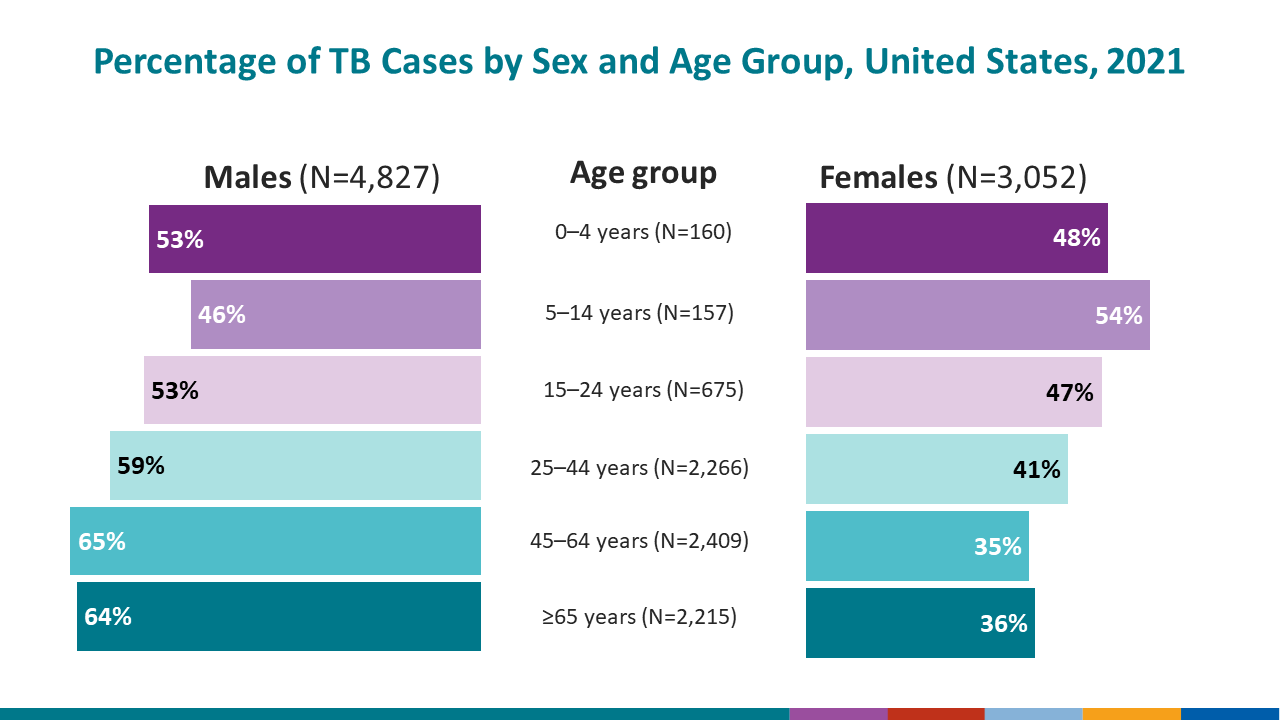
See Surveillance Slide #36
| Age group | Total cases | Total | U.S.-born2 | Non-U.S.–born2 | |||||||||||||||
|---|---|---|---|---|---|---|---|---|---|---|---|---|---|---|---|---|---|---|---|
| Male | Female | Male | Female | Male | Female | ||||||||||||||
| No. | (%) | Rate | No. | (%) | Rate | No. | (%) | Rate | No. | (%) | Rate | No. | (%) | Rate | No. | (%) | Rate | ||
| 0–4 | 160 | 84 | (52.5) | 0.9 | 76 | (47.5) | 0.8 | 81 | (52.9) | 0.8 | 72 | (47.1) | 0.8 | 3 | (42.9) | 2.9 | 4 | (57.1) | 3.5 |
| 5–14 | 157 | 72 | (45.9) | 0.3 | 85 | (54.1) | 0.4 | 55 | (53.9) | 0.3 | 47 | (46.1) | 0.2 | 17 | (30.9) | 2.3 | 38 | (69.1) | 4.2 |
| 15–24 | 675 | 360 | (53.3) | 1.7 | 314 | (46.5) | 1.5 | 118 | (50.4) | 0.6 | 116 | (49.6) | 0.6 | 242 | (54.9) | 14.6 | 198 | (44.9) | 13.6 |
| 25–44 | 2,266 | 1,330 | (58.7) | 3.1 | 934 | (41.2) | 2.1 | 325 | (59.6) | 0.9 | 220 | (40.4) | 0.6 | 1,003 | (58.4) | 12.5 | 713 | (41.5) | 8.7 |
| 45–64 | 2,409 | 1,564 | (64.9) | 4.0 | 845 | (35.1) | 2.0 | 456 | (68.1) | 1.4 | 214 | (31.9) | 0.6 | 1,094 | (63.6) | 13.9 | 626 | (36.4) | 7.5 |
| ≥65 | 2,215 | 1,417 | (64.0) | 5.6 | 798 | (36.0) | 2.6 | 357 | (68.8) | 1.6 | 162 | (31.2) | 0.6 | 1,053 | (62.5) | 31.4 | 632 | (37.5) | 15.0 |
1Persons born in the United States, certain U.S. territories, or elsewhere to at least one U.S. citizen parent are categorized as U.S.-born. All other persons are categorized as non-U.S.–born.
2Origin of birth was unknown for 33 persons.
Note: Incidence rates were created using Current Population Survey (CPS) Basic Monthly data set, obtained from https://data.census.gov/mdat/#/. The CPS does not include institutionalized persons.