Reported Tuberculosis in the United States, 2021
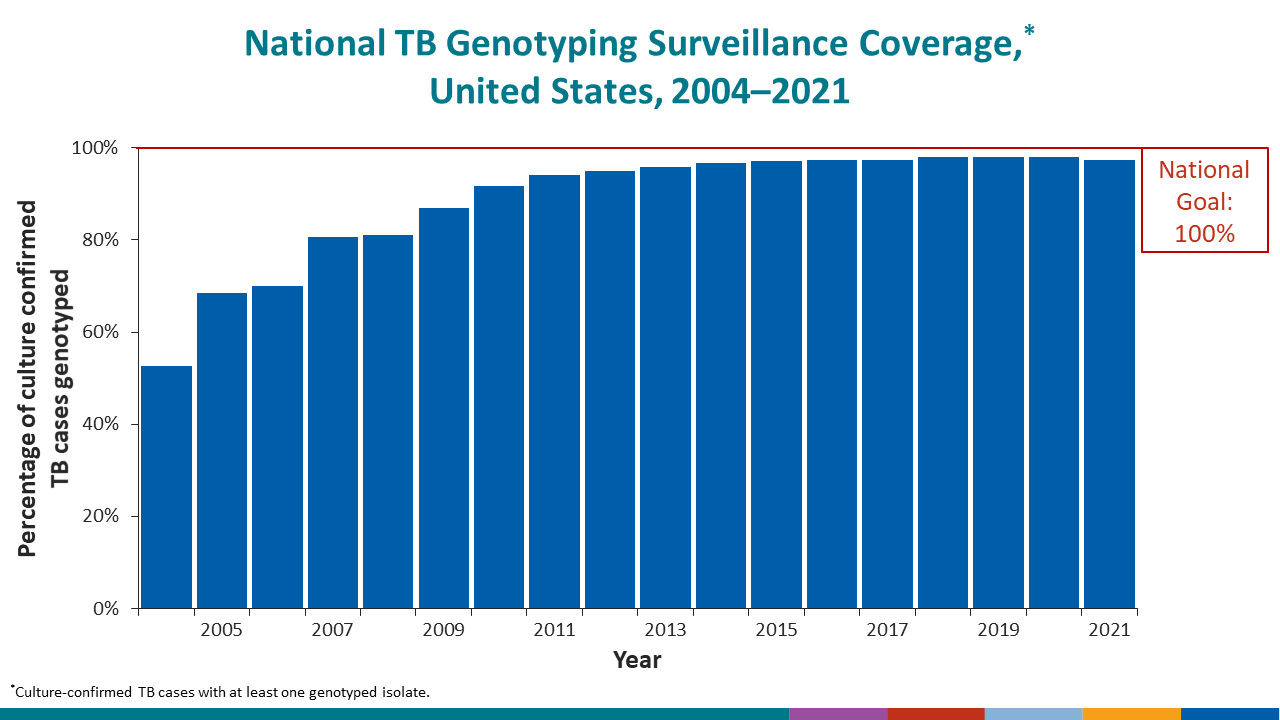
Table 24. National Tuberculosis Genotyping Surveillance Coverage:1 United States, 2004–2021
See Surveillance Slide #59.
| Year | Total cases | Culture-positive cases | Genotyped cases | Coverage (%) |
|---|---|---|---|---|
| 2021 | 7,882 | 6,244 | 6,075 | (97.3) |
| 2020 | 7,171 | 5,697 | 5,586 | (98.1) |
| 2019 | 8,898 | 7,101 | 6,966 | (98.1) |
| 2018 | 8,998 | 7,096 | 6,948 | (97.9) |
| 2017 | 9,069 | 7,129 | 6,946 | (97.4) |
| 2016 | 9,240 | 7,171 | 6,988 | (97.4) |
| 2015 | 9,538 | 7,413 | 7,201 | (97.1) |
| 2014 | 9,382 | 7,217 | 6,972 | (96.6) |
| 2013 | 9,539 | 7,356 | 7,049 | (95.8) |
| 2012 | 9,923 | 7,616 | 7,224 | (94.9) |
| 2011 | 10,474 | 8,059 | 7,593 | (94.2) |
| 2010 | 11,071 | 8,390 | 7,684 | (91.6) |
| 2009 | 11,494 | 8,863 | 7,700 | (86.9) |
| 2008 | 12,943 | 10,083 | 8,176 | (81.1) |
| 2007 | 13,274 | 10,439 | 8,425 | (80.7) |
| 2006 | 13,720 | 10,747 | 7,528 | (70.0) |
| 2005 | 14,053 | 10,955 | 7,497 | (68.4) |
| 2004 | 14,498 | 11,330 | 5,954 | (52.6) |
1Genotype surveillance coverage is defined as the percentage of all culture positive tuberculosis (TB) cases for which there was a genotyped isolate.
Note: This table reflects genotyping surveillance coverage for the 50 states and the District of Columbia; for genotyping surveillance coverage of the U.S.-affiliated reporting areas, please see Table 25.