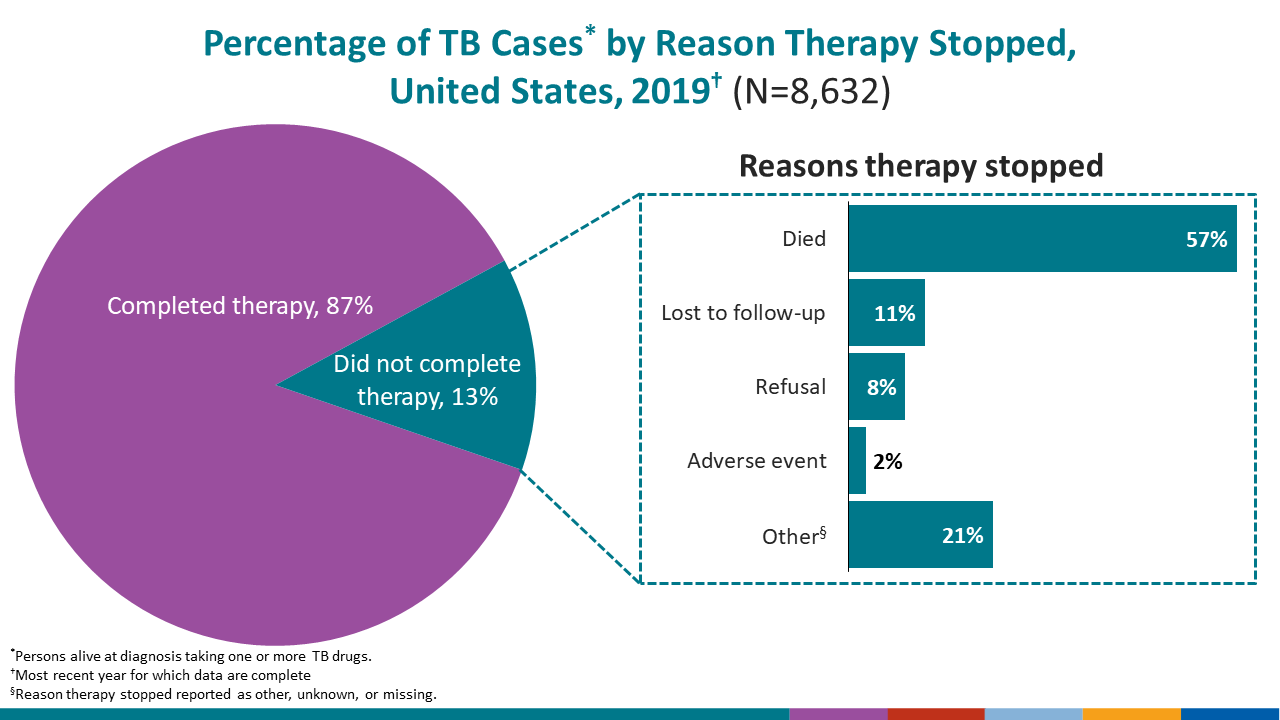
Reported Tuberculosis in the United States, 2021
Table 20. Tuberculosis Cases and Percentages by Reason Tuberculosis Therapy Was Stopped: United States, 1993–20191
See Surveillance Slide #47.
| Year | Total cases2 | Completed therapy | Adverse event3 | Moved4 | Lost | Refused | Died5 | Other | Unknown or missing | ||||||||
|---|---|---|---|---|---|---|---|---|---|---|---|---|---|---|---|---|---|
| No. | (%) | No. | (%) | No. | (%) | No. | (%) | No. | (%) | No. | (%) | No. | (%) | No. | (%) | ||
| 2019 | 8,632 | 7,496 | (86.8) | 28 | (0.3) | 0 | (0.0) | 127 | (1.5) | 94 | (1.1) | 647 | (7.5) | 171 | (2.0) | 69 | (0.8) |
| 2018 | 8,738 | 7,669 | (87.8) | 26 | (0.3) | 0 | (0.0) | 127 | (1.5) | 88 | (1.0) | 579 | (6.6) | 198 | (2.3) | 51 | (0.6) |
| 2017 | 8,843 | 7,766 | (87.8) | 31 | (0.4) | 0 | (0.0) | 113 | (1.3) | 78 | (0.9) | 601 | (6.8) | 203 | (2.3) | 51 | (0.6) |
| 2016 | 8,977 | 7,861 | (87.6) | 31 | (0.3) | 0 | (0.0) | 118 | (1.3) | 75 | (0.8) | 604 | (6.7) | 206 | (2.3) | 82 | (0.9) |
| 2015 | 9,281 | 8,186 | (88.2) | 18 | (0.2) | 0 | (0.0) | 110 | (1.2) | 72 | (0.8) | 574 | (6.2) | 247 | (2.7) | 74 | (0.8) |
| 2014 | 9,148 | 8,135 | (88.9) | 18 | (0.2) | 0 | (0.0) | 84 | (0.9) | 81 | (0.9) | 563 | (6.2) | 228 | (2.5) | 39 | (0.4) |
| 2013 | 9,259 | 8,164 | (88.2) | 39 | (0.4) | 0 | (0.0) | 101 | (1.1) | 68 | (0.7) | 582 | (6.3) | 240 | (2.6) | 65 | (0.7) |
| 2012 | 9,659 | 8,509 | (88.1) | 31 | (0.3) | 0 | (0.0) | 123 | (1.3) | 58 | (0.6) | 609 | (6.3) | 272 | (2.8) | 57 | (0.6) |
| 2011 | 10,175 | 8,966 | (88.1) | 27 | (0.3) | 0 | (0.0) | 126 | (1.2) | 68 | (0.7) | 685 | (6.7) | 261 | (2.6) | 42 | (0.4) |
| 2010 | 10,752 | 9,465 | (88.0) | 31 | (0.3) | 0 | (0.0) | 161 | (1.5) | 62 | (0.6) | 656 | (6.1) | 335 | (3.1) | 42 | (0.4) |
| 2009 | 11,159 | 9,807 | (87.9) | 22 | (0.2) | 96 | (0.9) | 165 | (1.5) | 82 | (0.7) | 681 | (6.1) | 265 | (2.4) | 41 | (0.4) |
| 2008 | 12,602 | 10,937 | (86.8) | 8 | (0.1) | 254 | (2.0) | 329 | (2.6) | 77 | (0.6) | 844 | (6.7) | 127 | (1.0) | 26 | (0.2) |
| 2007 | 12,898 | 11,330 | (87.8) | 0 | (0.0) | 236 | (1.8) | 327 | (2.5) | 72 | (0.6) | 818 | (6.3) | 80 | (0.6) | 35 | (0.3) |
| 2006 | 13,310 | 11,531 | (86.6) | 0 | (0.0) | 282 | (2.1) | 359 | (2.7) | 78 | (0.6) | 938 | (7.0) | 100 | (0.8) | 22 | (0.2) |
| 2005 | 13,666 | 11,715 | (85.7) | 1 | (0.0) | 314 | (2.3) | 340 | (2.5) | 90 | (0.7) | 986 | (7.2) | 68 | (0.5) | 152 | (1.1) |
| 2004 | 14,079 | 12,115 | (86.1) | 0 | (0.0) | 334 | (2.4) | 369 | (2.6) | 82 | (0.6) | 974 | (6.9) | 76 | (0.5) | 129 | (0.9) |
| 2003 | 14,376 | 12,411 | (86.3) | 0 | (0.0) | 311 | (2.2) | 390 | (2.7) | 84 | (0.6) | 994 | (6.9) | 80 | (0.6) | 106 | (0.7) |
| 2002 | 14,563 | 12,475 | (85.7) | 0 | (0.0) | 335 | (2.3) | 412 | (2.8) | 87 | (0.6) | 1,081 | (7.4) | 72 | (0.5) | 101 | (0.7) |
| 2001 | 15,407 | 13,234 | (85.9) | 0 | (0.0) | 378 | (2.5) | 402 | (2.6) | 99 | (0.6) | 1,122 | (7.3) | 90 | (0.6) | 82 | (0.5) |
| 2000 | 15,782 | 13,404 | (84.9) | 0 | (0.0) | 406 | (2.6) | 397 | (2.5) | 112 | (0.7) | 1,294 | (8.2) | 76 | (0.5) | 93 | (0.6) |
| 1999 | 16,855 | 14,227 | (84.4) | 0 | (0.0) | 452 | (2.7) | 359 | (2.1) | 104 | (0.6) | 1,437 | (8.5) | 102 | (0.6) | 174 | (1.0) |
| 1998 | 17,585 | 14,765 | (84.0) | 0 | (0.0) | 533 | (3.0) | 411 | (2.3) | 104 | (0.6) | 1,579 | (9.0) | 76 | (0.4) | 117 | (0.7) |
| 1997 | 18,932 | 15,673 | (82.8) | 0 | (0.0) | 667 | (3.5) | 444 | (2.3) | 119 | (0.6) | 1,755 | (9.3) | 102 | (0.5) | 172 | (0.9) |
| 1996 | 20,300 | 16,530 | (81.4) | 0 | (0.0) | 770 | (3.8) | 525 | (2.6) | 156 | (0.8) | 1,998 | (9.8) | 118 | (0.6) | 203 | (1.0) |
| 1995 | 21,706 | 17,306 | (79.7) | 0 | (0.0) | 955 | (4.4) | 570 | (2.6) | 155 | (0.7) | 2,396 | (11.0) | 155 | (0.7) | 169 | (0.8) |
| 1994 | 23,053 | 17,764 | (77.1) | 0 | (0.0) | 1,180 | (5.1) | 740 | (3.2) | 183 | (0.8) | 2,743 | (11.9) | 161 | (0.7) | 282 | (1.2) |
| 1993 | 23,743 | 18,043 | (76.0) | 0 | (0.0) | 1,107 | (4.7) | 1,086 | (4.6) | 223 | (0.9) | 3,053 | (12.9) | 179 | (0.8) | 52 | (0.2) |
1Most recent year for which data are complete.
2Persons alive at diagnosis taking one or more TB drugs.
3Data for adverse events were not collected until 2009.
4In 2009, the “moved” response option was removed from the RVCT’s “reason therapy stopped” variable.
5Died of any cause (not only TB).
Note: Data for all years are updated through July 8, 2022.
See Technical Notes.