Reported Tuberculosis in the United States, 2021
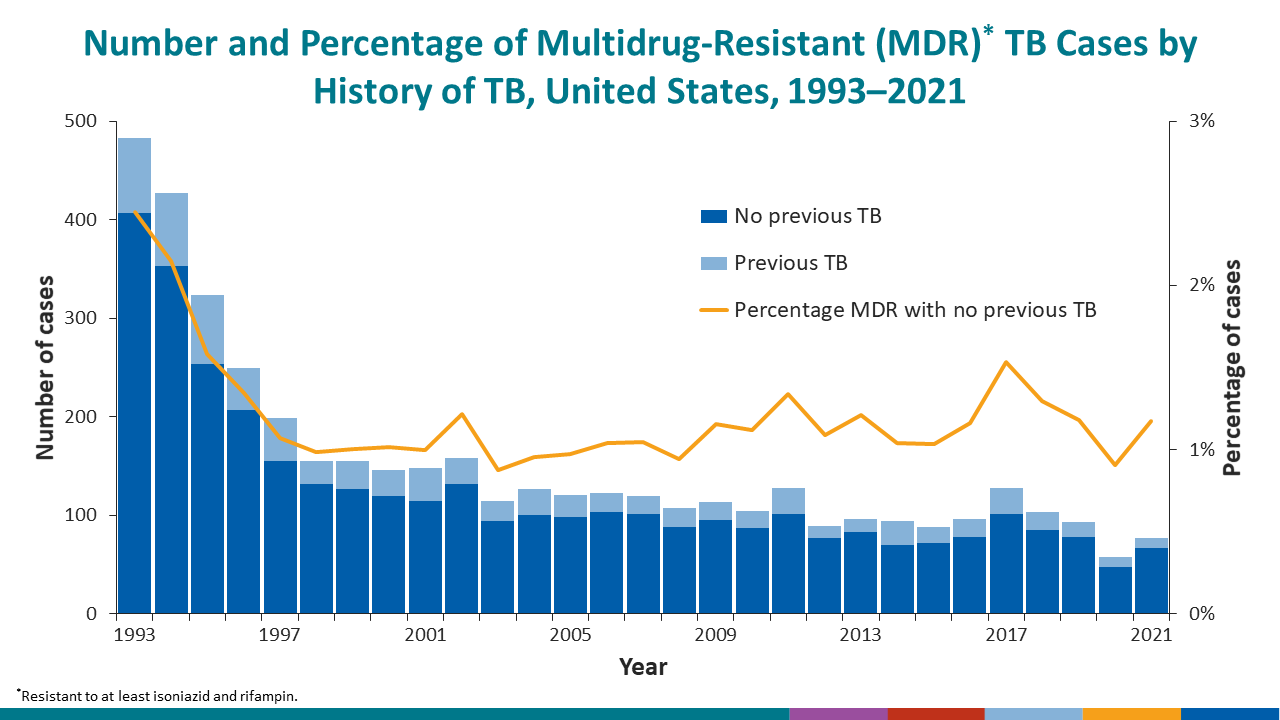
Table 15. Tuberculosis Cases and Percentages by Drug Resistance and History of Previous TB: United States, 1993–2021
See Surveillance Slide #49.
| Year | Total cases1 | Isoniazid (INH)-resistant2 | Multidrug resistant (MDR)3 | Previous TB | No previous TB | ||||||||||
|---|---|---|---|---|---|---|---|---|---|---|---|---|---|---|---|
| Total cases | INH-resistant | MDR | Total cases | INH-resistant | MDR | ||||||||||
| No. | (%) | No. | (%) | No. | (%) | No. | (%) | No. | (%) | No. | (%) | ||||
| 2021 | 6,005 | 536 | (8.9) | 77 | (1.3) | 216 | 30 | (13.9) | 10 | (4.6) | 5,698 | 498 | (8.7) | 67 | (1.2) |
| 2020 | 5,574 | 462 | (8.3) | 58 | (1.0) | 217 | 32 | (14.7) | 10 | (4.6) | 5,306 | 425 | (8.0) | 48 | (0.9) |
| 2019 | 6,909 | 661 | (9.6) | 93 | (1.3) | 271 | 37 | (13.7) | 15 | (5.5) | 6,591 | 618 | (9.4) | 78 | (1.2) |
| 2018 | 6,884 | 641 | (9.3) | 104 | (1.5) | 292 | 53 | (18.2) | 18 | (6.2) | 6,546 | 584 | (8.9) | 85 | (1.3) |
| 2017 | 6,891 | 634 | (9.2) | 129 | (1.9) | 280 | 55 | (19.6) | 27 | (9.6) | 6,584 | 575 | (8.7) | 101 | (1.5) |
| 2016 | 7,044 | 651 | (9.2) | 97 | (1.4) | 302 | 57 | (18.9) | 18 | (6.0) | 6,718 | 590 | (8.8) | 78 | (1.2) |
| 2015 | 7,304 | 685 | (9.4) | 88 | (1.2) | 319 | 51 | (16.0) | 16 | (5.0) | 6,959 | 633 | (9.1) | 72 | (1.0) |
| 2014 | 7,108 | 688 | (9.7) | 94 | (1.3) | 336 | 63 | (18.8) | 24 | (7.1) | 6,736 | 621 | (9.2) | 70 | (1.0) |
| 2013 | 7,204 | 675 | (9.4) | 97 | (1.3) | 301 | 49 | (16.3) | 13 | (4.3) | 6,854 | 621 | (9.1) | 83 | (1.2) |
| 2012 | 7,468 | 686 | (9.2) | 89 | (1.2) | 355 | 55 | (15.5) | 12 | (3.4) | 7,076 | 631 | (8.9) | 77 | (1.1) |
| 2011 | 7,913 | 753 | (9.5) | 128 | (1.6) | 344 | 60 | (17.4) | 27 | (7.8) | 7,529 | 686 | (9.1) | 101 | (1.3) |
| 2010 | 8,227 | 692 | (8.4) | 106 | (1.3) | 361 | 63 | (17.5) | 17 | (4.7) | 7,786 | 622 | (8.0) | 87 | (1.1) |
| 2009 | 8,660 | 762 | (8.8) | 115 | (1.3) | 343 | 52 | (15.2) | 19 | (5.5) | 8,221 | 699 | (8.5) | 95 | (1.2) |
| 2008 | 9,875 | 838 | (8.5) | 107 | (1.1) | 433 | 57 | (13.2) | 19 | (4.4) | 9,303 | 774 | (8.3) | 88 | (0.9) |
| 2007 | 10,244 | 799 | (7.8) | 124 | (1.2) | 496 | 71 | (14.3) | 19 | (3.8) | 9,655 | 715 | (7.4) | 101 | (1.0) |
| 2006 | 10,480 | 845 | (8.1) | 124 | (1.2) | 494 | 67 | (13.6) | 20 | (4.0) | 9,912 | 770 | (7.8) | 103 | (1.0) |
| 2005 | 10,647 | 842 | (7.9) | 125 | (1.2) | 507 | 70 | (13.8) | 23 | (4.5) | 10,064 | 761 | (7.6) | 98 | (1.0) |
| 2004 | 11,100 | 872 | (7.9) | 128 | (1.2) | 538 | 64 | (11.9) | 27 | (5.0) | 10,484 | 801 | (7.6) | 100 | (1.0) |
| 2003 | 11,382 | 904 | (7.9) | 119 | (1.0) | 524 | 65 | (12.4) | 21 | (4.0) | 10,758 | 824 | (7.7) | 94 | (0.9) |
| 2002 | 11,554 | 915 | (7.9) | 158 | (1.4) | 571 | 80 | (14.0) | 26 | (4.6) | 10,828 | 828 | (7.6) | 132 | (1.2) |
| 2001 | 12,292 | 897 | (7.3) | 151 | (1.2) | 629 | 87 | (13.8) | 33 | (5.2) | 11,520 | 800 | (6.9) | 115 | (1.0) |
| 2000 | 12,558 | 981 | (7.8) | 146 | (1.2) | 632 | 84 | (13.3) | 26 | (4.1) | 11,832 | 889 | (7.5) | 120 | (1.0) |
| 1999 | 13,483 | 1,000 | (7.4) | 157 | (1.2) | 669 | 82 | (12.3) | 28 | (4.2) | 12,659 | 900 | (7.1) | 127 | (1.0) |
| 1998 | 14,275 | 1,121 | (7.9) | 155 | (1.1) | 749 | 98 | (13.1) | 23 | (3.1) | 13,422 | 1,011 | (7.5) | 132 | (1.0) |
| 1997 | 15,270 | 1,195 | (7.8) | 201 | (1.3) | 742 | 109 | (14.7) | 44 | (5.9) | 14,451 | 1,078 | (7.5) | 155 | (1.1) |
| 1996 | 16,329 | 1,284 | (7.9) | 250 | (1.5) | 862 | 142 | (16.5) | 43 | (5.0) | 15,361 | 1,133 | (7.4) | 207 | (1.3) |
| 1995 | 17,094 | 1,352 | (7.9) | 327 | (1.9) | 958 | 168 | (17.5) | 70 | (7.3) | 16,024 | 1,174 | (7.3) | 254 | (1.6) |
| 1994 | 17,623 | 1,543 | (8.8) | 431 | (2.4) | 1,033 | 175 | (16.9) | 74 | (7.2) | 16,418 | 1,352 | (8.2) | 353 | (2.2) |
| 1993 | 17,705 | 1,534 | (8.7) | 484 | (2.7) | 982 | 161 | (16.4) | 76 | (7.7) | 16,604 | 1,367 | (8.2) | 407 | (2.5) |
1Persons with isolates tested with at least isoniazid and rifiampin.
2Resistance to at least isoniazid.
3Resistance to at least isoniazid and rifampin.
Note: Data for all years are updated through July 8, 2022.