Reported Tuberculosis in the United States, 2020
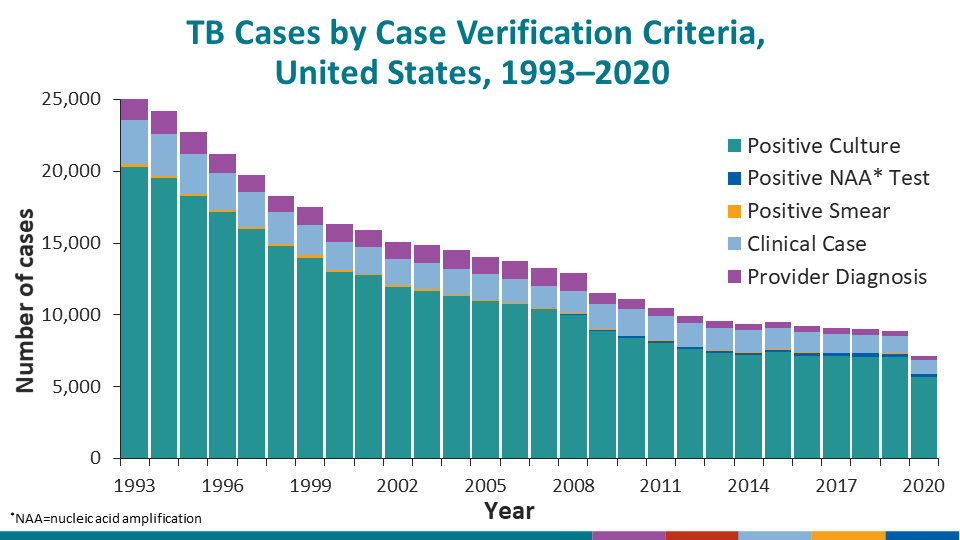
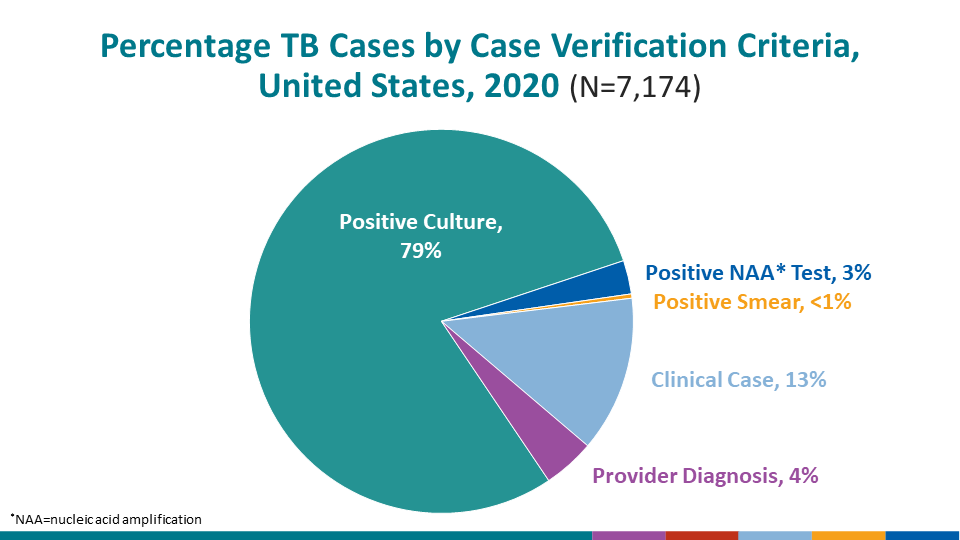
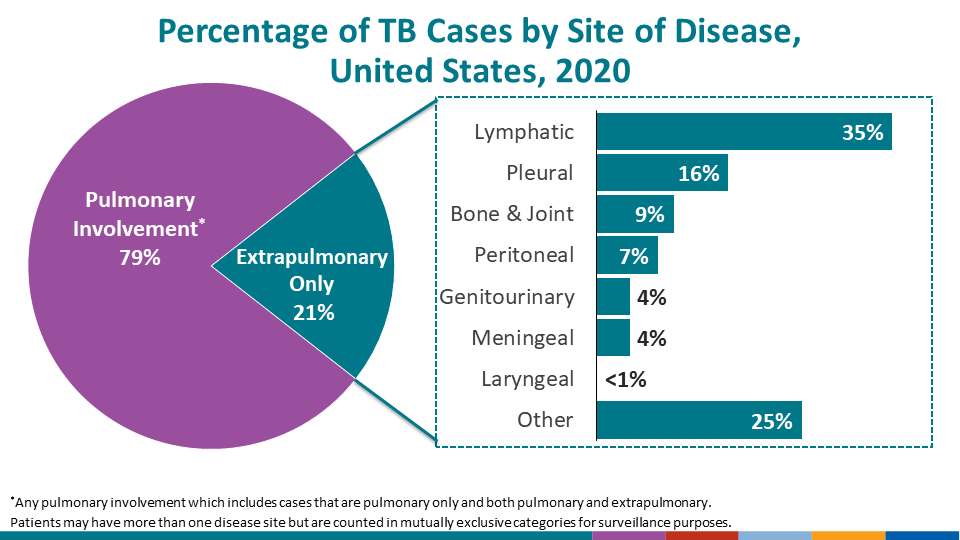
Table 7. Tuberculosis Cases and Percentages by Case Verification Criterion and Site of Disease: United States, 1993–2020
See Surveillance Slides #46, #47 and #48.
| Year | Total Cases | Verification Criterion1 | Site of Disease5 | ||||||||||||
|---|---|---|---|---|---|---|---|---|---|---|---|---|---|---|---|
| Positive Culture | Positive NAA2 | Positive Smear | Clinical Case Definition | Provider Diagnosis | Pulmonary3 | Extrapulmonary4 | |||||||||
| No. | (%) | No. | (%) | No. | (%) | No. | (%) | No. | (%) | No. | (%) | No. | (%) | ||
| 1993 | 25,105 | 20,309 | (80.9) | –– | –– | 185 | (0.7) | 3,088 | (12.3) | 1,523 | (6.1) | 21,156 | (84.3) | 3,940 | (15.7) |
| 1994 | 24,208 | 19,509 | (80.6) | –– | –– | 189 | (0.8) | 2,917 | (12.0) | 1,593 | (6.6) | 20,318 | (83.9) | 3,886 | (16.1) |
| 1995 | 22,727 | 18,266 | (80.4) | –– | –– | 189 | (0.8) | 2,749 | (12.1) | 1,523 | (6.7) | 18,887 | (83.1) | 3,834 | (16.9) |
| 1996 | 21,212 | 17,156 | (80.9) | –– | –– | 131 | (0.6) | 2,607 | (12.3) | 1,318 | (6.2) | 17,387 | (82.0) | 3,814 | (18.0) |
| 1997 | 19,753 | 15,981 | (80.9) | –– | –– | 155 | (0.8) | 2,411 | (12.2) | 1,206 | (6.1) | 16,241 | (82.2) | 3,509 | (17.8) |
| 1998 | 18,288 | 14,791 | (80.9) | –– | –– | 155 | (0.8) | 2,253 | (12.3) | 1,089 | (6.0) | 14,803 | (81.0) | 3,483 | (19.0) |
| 1999 | 17,500 | 13,995 | (80.0) | –– | –– | 172 | (1.0) | 2,103 | (12.0) | 1,230 | (7.0) | 14,065 | (80.4) | 3,431 | (19.6) |
| 2000 | 16,308 | 13,013 | (79.8) | –– | –– | 148 | (0.9) | 1,950 | (12.0) | 1,197 | (7.3) | 13,085 | (80.3) | 3,211 | (19.7) |
| 2001 | 15,949 | 12,754 | (80.0) | –– | –– | 123 | (0.8) | 1,886 | (11.8) | 1,186 | (7.4) | 12,728 | (79.8) | 3,217 | (20.2) |
| 2002 | 15,060 | 11,978 | (79.5) | –– | –– | 104 | (0.7) | 1,822 | (12.1) | 1,156 | (7.7) | 11,906 | (79.1) | 3,148 | (20.9) |
| 2003 | 14,838 | 11,686 | (78.8) | –– | –– | 116 | (0.8) | 1,783 | (12.0) | 1,253 | (8.4) | 11,808 | (79.6) | 3,020 | (20.4) |
| 2004 | 14,502 | 11,330 | (78.1) | –– | –– | 80 | (0.6) | 1,824 | (12.6) | 1,268 | (8.7) | 11,526 | (79.5) | 2,972 | (20.5) |
| 2005 | 14,063 | 10,955 | (77.9) | –– | –– | 96 | (0.7) | 1,797 | (12.8) | 1,213 | (8.6) | 11,126 | (79.1) | 2,931 | (20.9) |
| 2006 | 13,730 | 10,747 | (78.3) | –– | –– | 93 | (0.7) | 1,629 | (11.9) | 1,261 | (9.2) | 10,854 | (79.1) | 2,873 | (20.9) |
| 2007 | 13,288 | 10,434 | (78.5) | –– | –– | 69 | (0.5) | 1,496 | (11.3) | 1,289 | (9.7) | 10,595 | (79.8) | 2,688 | (20.2) |
| 2008 | 12,893 | 10,024 | (77.7) | 18 | (0.1) | 60 | (0.5) | 1,547 | (12.0) | 1,244 | (9.6) | 10,239 | (79.4) | 2,649 | (20.6) |
| 2009 | 11,499 | 8,866 | (77.1) | 57 | (0.5) | 73 | (0.6) | 1,777 | (15.5) | 726 | (6.3) | 8,997 | (78.3) | 2,490 | (21.7) |
| 2010 | 11,076 | 8,391 | (75.8) | 107 | (1.0) | 69 | (0.6) | 1,864 | (16.8) | 645 | (5.8) | 8,664 | (78.2) | 2,411 | (21.8) |
| 2011 | 10,480 | 8,063 | (76.9) | 121 | (1.2) | 61 | (0.6) | 1,673 | (16.0) | 562 | (5.4) | 8,314 | (79.4) | 2,163 | (20.6) |
| 2012 | 9,925 | 7,616 | (76.7) | 118 | (1.2) | 38 | (0.4) | 1,643 | (16.6) | 510 | (5.1) | 7,841 | (79.1) | 2,078 | (20.9) |
| 2013 | 9,545 | 7,355 | (77.1) | 149 | (1.6) | 47 | (0.5) | 1,507 | (15.8) | 487 | (5.1) | 7,575 | (79.4) | 1,969 | (20.6) |
| 2014 | 9,383 | 7,217 | (76.9) | 161 | (1.7) | 45 | (0.5) | 1,495 | (15.9) | 465 | (5.0) | 7,456 | (79.5) | 1,923 | (20.5) |
| 2015 | 9,536 | 7,409 | (77.7) | 174 | (1.8) | 44 | (0.5) | 1,467 | (15.4) | 442 | (4.6) | 7,627 | (80.0) | 1,905 | (20.0) |
| 2016 | 9,242 | 7,171 | (77.6) | 183 | (2.0) | 37 | (0.4) | 1,411 | (15.3) | 440 | (4.8) | 7,365 | (79.8) | 1,869 | (20.2) |
| 2017 | 9,071 | 7,130 | (78.6) | 193 | (2.1) | 32 | (0.4) | 1,326 | (14.6) | 390 | (4.3) | 7,182 | (79.3) | 1,874 | (20.7) |
| 2018 | 9,006 | 7,102 | (78.9) | 234 | (2.6) | 35 | (0.4) | 1,261 | (14.0) | 374 | (4.2) | 7,194 | (80.0) | 1,800 | (20.0) |
| 2019 | 8,904 | 7,100 | (79.7) | 190 | (2.1) | 32 | (0.4) | 1,212 | (13.6) | 370 | (4.2) | 7,077 | (79.6) | 1,818 | (20.4) |
| 2020 | 7,174 | 5,691 | (79.3) | 203 | (2.8) | 26 | (0.4) | 943 | (13.1) | 311 | (4.3) | 5,654 | (78.9) | 1,513 | (21.1) |
1Based on the public health surveillance case definition for tuberculosis; see Appendix A.
2Nucleic Acid Amplification test. Information not collected before 2008; complete data available beginning in 2010.
3Includes all cases among persons with pulmonary as the only site of disease, and persons with both pulmonary and extrapulmonary sites of disease.
4Includes cases among persons with extrapulmonary TB disease only.
5During 1993–2020, 0.04% had missing data, for 2020, 0.10% had missing data.
Data for all years updated through June 14, 2021.
Note: See Technical Notes.
Double dashes (––) indicate that data not available.