Reported Tuberculosis in the United States, 2020
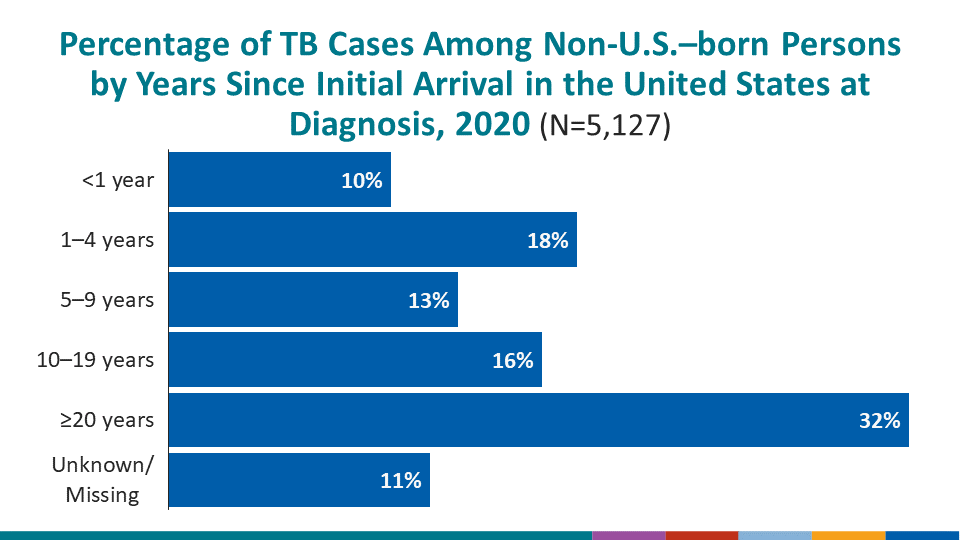
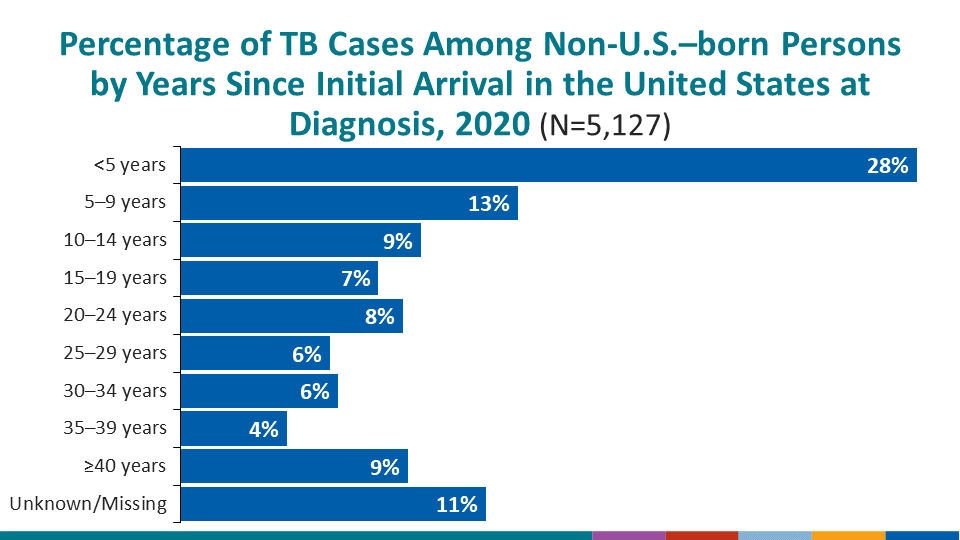
Table 6C. Tuberculosis Percentages Among Non-U.S.–Born Persons,1 by Number of Years in the United States, 1993–2020
See Surveillance Slides #16 and #17.
| Year | No. Years in United States2 | ||||||||||
|---|---|---|---|---|---|---|---|---|---|---|---|
| <1 | 1–4 | 5–9 | 10–14 | 15–19 | 20–24 | 25–29 | 30–34 | 35–39 | ≥40 | Unknown/ missing | |
| (%) | (%) | (%) | (%) | (%) | (%) | (%) | (%) | (%) | (%) | (%) | |
| 1993 | (20.5) | (15.7) | (9.1) | (8.3) | (3.4) | (2.6) | (1.2) | (0.7) | (0.7) | (1.6) | (36.3) |
| 1994 | (19.7) | (17.2) | (9.4) | (8.2) | (4.5) | (2.6) | (1.7) | (0.9) | (0.8) | (1.3) | (33.8) |
| 1995 | (19.0) | (15.9) | (11.1) | (7.4) | (5.2) | (2.9) | (1.6) | (0.8) | (0.8) | (1.6) | (33.7) |
| 1996 | (19.0) | (16.4) | (11.7) | (8.1) | (6.0) | (3.0) | (2.3) | (0.9) | (0.7) | (1.9) | (29.8) |
| 1997 | (18.4) | (16.8) | (14.4) | (8.0) | (6.7) | (3.2) | (2.8) | (1.3) | (1.1) | (1.9) | (25.4) |
| 1998 | (17.4) | (20.4) | (15.9) | (9.4) | (7.8) | (4.4) | (3.1) | (1.9) | (1.1) | (2.5) | (16.1) |
| 1999 | (19.6) | (20.8) | (14.5) | (9.2) | (8.4) | (4.6) | (3.0) | (1.7) | (1.1) | (2.5) | (14.6) |
| 2000 | (21.3) | (20.6) | (13.8) | (9.8) | (6.6) | (5.5) | (2.5) | (1.9) | (1.0) | (2.9) | (14.1) |
| 2001 | (22.0) | (21.9) | (13.2) | (9.8) | (6.0) | (5.6) | (2.8) | (2.2) | (1.1) | (2.0) | (13.4) |
| 2002 | (19.3) | (24.6) | (12.8) | (9.8) | (6.0) | (6.1) | (2.8) | (2.3) | (1.0) | (2.1) | (13.3) |
| 2003 | (18.0) | (24.6) | (13.2) | (10.4) | (6.0) | (6.7) | (2.7) | (2.3) | (1.2) | (2.6) | (12.2) |
| 2004 | (20.7) | (23.1) | (13.1) | (9.5) | (6.5) | (6.5) | (3.3) | (2.3) | (1.3) | (2.6) | (11.2) |
| 2005 | (19.0) | (22.3) | (14.5) | (9.4) | (7.2) | (5.6) | (4.2) | (2.8) | (1.7) | (2.4) | (10.9) |
| 2006 | (19.6) | (21.5) | (15.1) | (9.1) | (7.8) | (5.3) | (4.7) | (2.6) | (2.0) | (2.8) | (9.5) |
| 2007 | (19.8) | (21.4) | (14.9) | (8.4) | (7.7) | (5.6) | (5.1) | (2.7) | (2.1) | (2.5) | (9.6) |
| 2008 | (17.3) | (20.5) | (15.4) | (8.7) | (8.0) | (5.8) | (5.7) | (2.5) | (1.9) | (3.0) | (11.4) |
| 2009 | (14.7) | (20.6) | (15.7) | (9.9) | (8.6) | (6.0) | (5.7) | (3.4) | (2.5) | (3.2) | (9.6) |
| 2010 | (16.3) | (18.9) | (14.7) | (10.2) | (7.4) | (7.4) | (4.9) | (3.9) | (2.4) | (4.1) | (10.0) |
| 2011 | (14.4) | (17.2) | (15.9) | (12.4) | (7.8) | (6.8) | (5.0) | (4.6) | (2.5) | (4.4) | (9.1) |
| 2012 | (14.9) | (17.6) | (14.9) | (11.9) | (7.3) | (7.3) | (5.1) | (5.4) | (2.8) | (4.6) | (8.2) |
| 2013 | (15.4) | (16.1) | (14.0) | (12.5) | (7.4) | (7.8) | (5.4) | (5.2) | (2.5) | (4.6) | (9.0) |
| 2014 | (16.1) | (14.9) | (13.7) | (11.0) | (7.8) | (8.1) | (5.4) | (5.5) | (3.0) | (5.3) | (9.1) |
| 2015 | (16.7) | (16.0) | (12.3) | (10.8) | (8.7) | (6.8) | (5.5) | (5.1) | (3.8) | (5.2) | (9.0) |
| 2016 | (17.4) | (15.6) | (12.0) | (10.6) | (8.9) | (6.3) | (5.9) | (4.5) | (4.1) | (5.6) | (9.1) |
| 2017 | (15.9) | (16.5) | (11.8) | (8.8) | (9.3) | (6.7) | (6.3) | (4.3) | (4.3) | (5.6) | (10.6) |
| 2018 | (14.6) | (16.8) | (10.9) | (9.6) | (9.1) | (6.6) | (6.3) | (4.9) | (4.3) | (6.2) | (10.7) |
| 2019 | (13.5) | (16.8) | (10.9) | (9.1) | (8.4) | (7.0) | (6.5) | (5.0) | (4.7) | (6.9) | (11.3) |
| 2020 | (9.7) | (17.8) | (12.6) | (9.0) | (7.4) | (8.3) | (5.6) | (5.9) | (4.0) | (8.5) | (11.4) |
1Includes persons born outside the United States (including the U.S. territories), except persons born to at least one U.S. citizen parent.
2Among non-U.S.–born persons, the number of years since arrival in the United States before diagnosis with tuberculosis.