Reported Tuberculosis in the United States, 2020
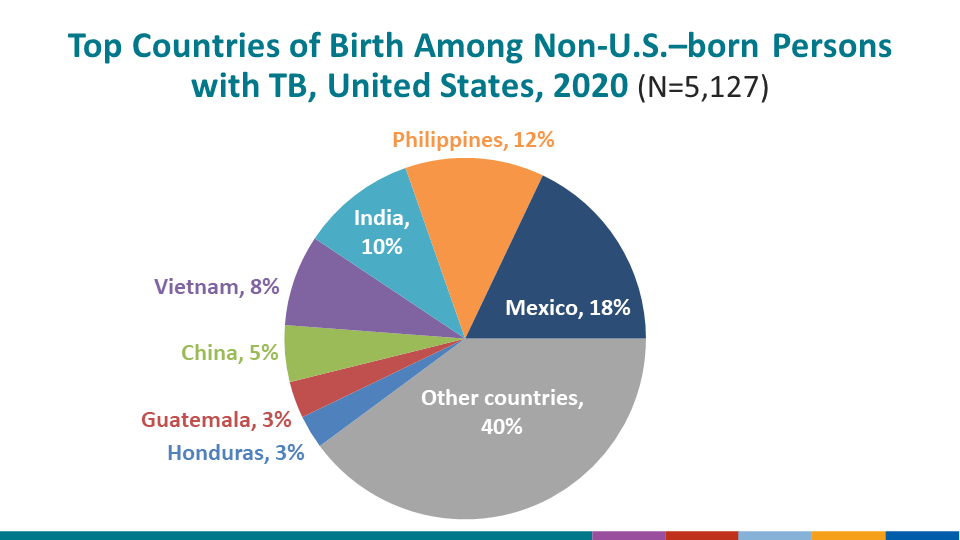
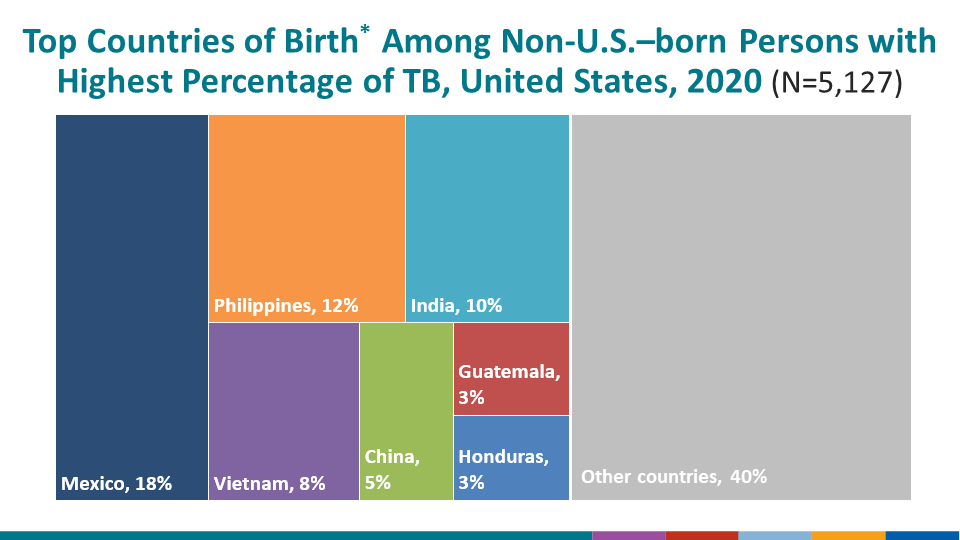
Table 6A. Tuberculosis Cases and Percentages Among Non-U.S.–Born Persons1 by the Top 30 Countries2 of Birth: United States, 2016–2020
See Surveillance Slides #13 and #14.
| Country of Birth | Year | |||||||||
|---|---|---|---|---|---|---|---|---|---|---|
| 2020 | 2019 | 2018 | 2017 | 2016 | ||||||
| No. | (%) | No. | (%) | No. | (%) | No. | (%) | No. | (%) | |
| Total Cases | 5,127 | (100.0) | 6,367 | (100.0) | 6,356 | (100.0) | 6,399 | (100.0) | 6,353 | (100.0) |
| Mexico | 925 | (18.0) | 1,188 | (18.7) | 1,210 | (19.0) | 1,217 | (19.0) | 1,188 | (18.7) |
| Philippines | 640 | (12.5) | 796 | (12.5) | 780 | (12.3) | 794 | (12.4) | 791 | (12.5) |
| India | 531 | (10.4) | 578 | (9.1) | 632 | (9.9) | 602 | (9.4) | 588 | (9.3) |
| Vietnam | 421 | (8.2) | 506 | (8.0) | 512 | (8.1) | 534 | (8.4) | 492 | (7.7) |
| China | 261 | (5.1) | 390 | (6.1) | 382 | (6.0) | 404 | (6.3) | 382 | (6.0) |
| Guatemala | 169 | (3.3) | 232 | (3.6) | 209 | (3.3) | 176 | (2.8) | 189 | (3.0) |
| Haiti | 126 | (2.5) | 162 | (2.5) | 131 | (2.1) | 163 | (2.6) | 169 | (2.7) |
| Honduras | 129 | (2.5) | 192 | (3.0) | 142 | (2.2) | 128 | (2.0) | 146 | (2.3) |
| Ethiopia | 102 | (2.0) | 138 | (2.2) | 150 | (2.4) | 153 | (2.4) | 148 | (2.3) |
| Myanmar | 80 | (1.6) | 105 | (1.7) | 110 | (1.7) | 121 | (1.9) | 128 | (2.0) |
| El Salvador | 100 | (2.0) | 98 | (1.5) | 109 | (1.7) | 99 | (1.6) | 118 | (1.9) |
| Nepal | 83 | (1.6) | 98 | (1.5) | 100 | (1.6) | 82 | (1.3) | 102 | (1.6) |
| Pakistan | 74 | (1.4) | 110 | (1.7) | 104 | (1.6) | 88 | (1.4) | 84 | (1.3) |
| Korea, Republic of | 65 | (1.3) | 95 | (1.5) | 82 | (1.3) | 89 | (1.4) | 96 | (1.5) |
| Somalia | 62 | (1.2) | 65 | (1.0) | 73 | (1.2) | 99 | (1.6) | 100 | (1.6) |
| Nigeria | 47 | (0.9) | 67 | (1.1) | 72 | (1.1) | 85 | (1.3) | 91 | (1.4) |
| Peru | 63 | (1.2) | 79 | (1.2) | 78 | (1.2) | 62 | (1.0) | 67 | (1.1) |
| Cambodia | 57 | (1.1) | 95 | (1.5) | 67 | (1.1) | 63 | (1.0) | 66 | (1.0) |
| Ecuador | 61 | (1.2) | 58 | (0.9) | 77 | (1.2) | 81 | (1.3) | 69 | (1.1) |
| Bangladesh | 67 | (1.3) | 64 | (1.0) | 61 | (1.0) | 71 | (1.1) | 60 | (0.9) |
| Dominican Republic | 56 | (1.1) | 59 | (0.9) | 56 | (0.9) | 69 | (1.1) | 61 | (1.0) |
| Laos | 42 | (0.8) | 53 | (0.8) | 56 | (0.9) | 72 | (1.1) | 69 | (1.1) |
| Kenya | 36 | (0.7) | 57 | (0.9) | 54 | (0.9) | 46 | (0.7) | 46 | (0.7) |
| Colombia | 31 | (0.6) | 50 | (0.8) | 48 | (0.8) | 37 | (0.6) | 50 | (0.8) |
| Marshall Islands | 44 | (0.9) | 45 | (0.7) | 41 | (0.7) | 47 | (0.7) | 24 | (0.4) |
| Congo | 33 | (0.6) | 38 | (0.6) | 47 | (0.7) | 37 | (0.6) | 32 | (0.5) |
| Afghanistan | 32 | (0.6) | 42 | (0.7) | 39 | (0.6) | 38 | (0.6) | 31 | (0.5) |
| Bhutan | 21 | (0.4) | 32 | (0.5) | 45 | (0.7) | 53 | (0.8) | 30 | (0.5) |
| Thailand | 36 | (0.7) | 31 | (0.5) | 32 | (0.5) | 37 | (0.6) | 43 | (0.7) |
| Indonesia | 25 | (0.5) | 29 | (0.5) | 35 | (0.6) | 28 | (0.4) | 40 | (0.6) |
| All Others3 | 708 | (13.8) | 815 | (12.8) | 822 | (12.8) | 824 | (12.9) | 853 | (13.4) |
1Includes persons born outside the United States (including U.S. territories), except persons born to at least one U.S. citizen parent.
2The top 30 countries were selected based on their ranked 5-year average number of TB cases.
3Includes cases where country of birth is “missing” or “not specified”.
Note: Data for all years updated through June 14, 2021. Countries are in descending order by total case count for all years combined.