Reported Tuberculosis in the United States, 2020
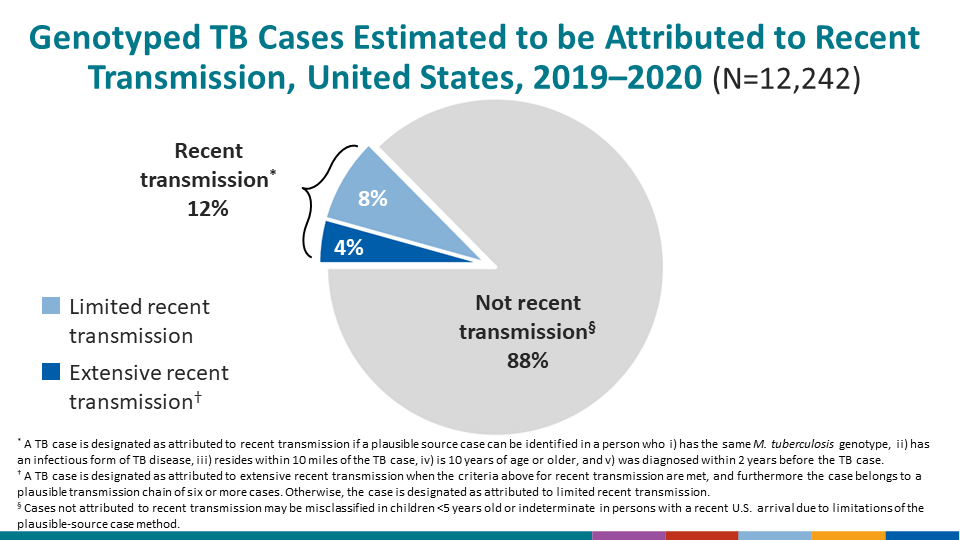
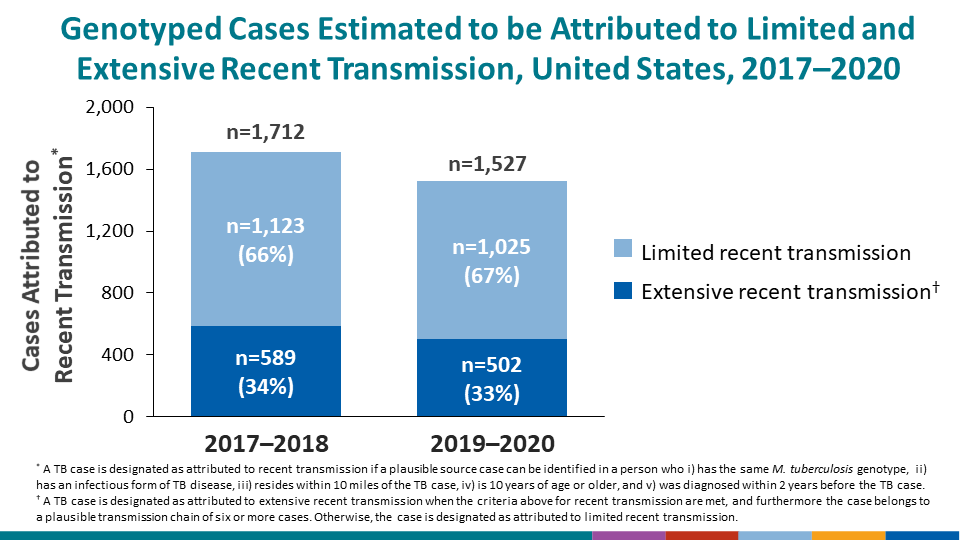
Table 57. Counts and Percentages of Tuberculosis Cases Estimated to be Attributed to Recent Transmission and Extensive Recent Transmission: Reporting Areas, 2019–2020
See Surveillance Slide #70 and #71.
| Reporting Area | Total Genotyped Cases1 | Cases Not Attributed to Recent Transmission | Cases Attributed to Recent Transmission2 | Cases Attributed to Extensive Recent Transmission3 | |||
|---|---|---|---|---|---|---|---|
| No. | % | No. | % | No. | % | ||
| United States | 12,242 | 10,715 | (87.5) | 1,527 | (12.5) | 502 | (4.1) |
| Alabama | 131 | 114 | (87.0) | 17 | (13.0) | 6 | (4.6) |
| Alaska | 86 | 44 | (51.2) | 42 | (48.8) | 16 | (18.6) |
| Arizona | 235 | 214 | (91.1) | 21 | (8.9) | 0 | (0.0) |
| Arkansas | 92 | 70 | (76.1) | 22 | (23.9) | 8 | (8.7) |
| California | 2936 | 2550 | (86.9) | 386 | (13.1) | 152 | (5.2) |
| Colorado | 77 | 73 | (94.8) | 4 | (5.2) | 0 | (0.0) |
| Connecticut | 99 | 93 | (93.9) | 6 | (6.1) | 1 | (1.0) |
| Delaware | 25 | 20 | (80.0) | 5 | (20.0) | 2 | (8.0) |
| District of Columbia | 29 | 28 | (96.6) | 1 | (3.4) | 0 | (0.0) |
| Florida | 789 | 683 | (86.6) | 106 | (13.4) | 34 | (4.3) |
| Georgia | 383 | 330 | (86.2) | 53 | (13.8) | 15 | (3.9) |
| Hawaii | 149 | 121 | (81.2) | 28 | (18.8) | 15 | (10.1) |
| Idaho | 13 | 13 | (100.0) | 0 | (0.0) | 0 | (0.0) |
| Illinois | 355 | 325 | (91.5) | 30 | (8.5) | 7 | (2.0) |
| Indiana | 145 | 128 | (88.3) | 17 | (11.7) | 0 | (0.0) |
| Iowa | 66 | 63 | (95.5) | 3 | (4.5) | 0 | (0.0) |
| Kansas | 65 | 62 | (95.4) | 3 | (4.6) | 0 | (0.0) |
| Kentucky | 89 | 84 | (94.4) | 5 | (5.6) | 0 | (0.0) |
| Louisiana | 118 | 95 | (80.5) | 23 | (19.5) | 5 | (4.2) |
| Maine | 29 | 27 | (93.1) | 2 | (6.9) | 1 | (3.4) |
| Maryland | 273 | 250 | (91.6) | 23 | (8.4) | 11 | (4.0) |
| Massachusetts | 246 | 234 | (95.1) | 12 | (4.9) | 1 | (0.4) |
| Michigan | 154 | 139 | (90.3) | 15 | (9.7) | 0 | (0.0) |
| Minnesota | 216 | 192 | (88.9) | 24 | (11.1) | 11 | (5.1) |
| Mississippi | 70 | 57 | (81.4) | 13 | (18.6) | 7 | (10.0) |
| Missouri | 108 | 101 | (93.5) | 7 | (6.5) | 2 | (1.9) |
| Montana | 5 | 5 | (100.0) | 0 | (0.0) | 0 | (0.0) |
| Nebraska | 37 | 33 | (89.2) | 4 | (10.8) | 0 | (0.0) |
| Nevada | 89 | 79 | (88.8) | 10 | (11.2) | 0 | (0.0) |
| New Hampshire | 18 | 18 | (100.0) | 0 | (0.0) | 0 | (0.0) |
| New Jersey | 428 | 401 | (93.7) | 27 | (6.3) | 5 | (1.2) |
| New Mexico | 53 | 49 | (92.5) | 4 | (7.5) | 0 | (0.0) |
| New York State4 | 274 | 266 | (97.1) | 8 | (2.9) | 1 | (0.4) |
| New York City | 799 | 679 | (85.0) | 120 | (15.0) | 45 | (5.6) |
| North Carolina | 293 | 245 | (83.6) | 48 | (16.4) | 22 | (7.5) |
| North Dakota | 22 | 21 | (95.5) | 1 | (4.5) | 0 | (0.0) |
| Ohio | 196 | 175 | (89.3) | 21 | (10.7) | 0 | (0.0) |
| Oklahoma | 95 | 76 | (80.0) | 19 | (20.0) | 8 | (8.4) |
| Oregon | 94 | 82 | (87.2) | 12 | (12.8) | 5 | (5.3) |
| Pennsylvania | 282 | 260 | (92.2) | 22 | (7.8) | 3 | (1.1) |
| Rhode Island | 14 | 14 | (100.0) | 0 | (0.0) | 0 | (0.0) |
| South Carolina | 122 | 110 | (90.2) | 12 | (9.8) | 1 | (0.8) |
| South Dakota | 26 | 21 | (80.8) | 5 | (19.2) | 0 | (0.0) |
| Tennessee | 176 | 147 | (83.5) | 29 | (16.5) | 9 | (5.1) |
| Texas | 1530 | 1286 | (84.1) | 244 | (15.9) | 101 | (6.6) |
| Utah | 37 | 35 | (94.6) | 2 | (5.4) | 0 | (0.0) |
| Vermont | 5 | 5 | (100.0) | 0 | (0.0) | 0 | (0.0) |
| Virginia | 279 | 259 | (92.8) | 20 | (7.2) | 0 | (0.0) |
| Washington | 300 | 254 | (84.7) | 46 | (15.3) | 8 | (2.7) |
| West Virginia | 12 | 12 | (100.0) | 0 | (0.0) | 0 | (0.0) |
| Wisconsin | 77 | 72 | (93.5) | 5 | (6.5) | 0 | (0.0) |
| Wyoming | 1 | 1 | (100.0) | 0 | (0.0) | 0 | (0.0) |
1Total number of M. tuberculosis genotyped cases that are eligible to be evaluated for recent transmission (i.e., complete data for the plausible-source case method’s algorithm).
2Number of cases attributed to recent transmission includes any given case with a plausible source case regardless of cluster size.
3Number of cases attributed to extensive recent transmission includes only cases in a plausible chain of transmission of six or more cases (five secondary and one source case).
4Excludes New York City.