Reported Tuberculosis in the United States, 2020
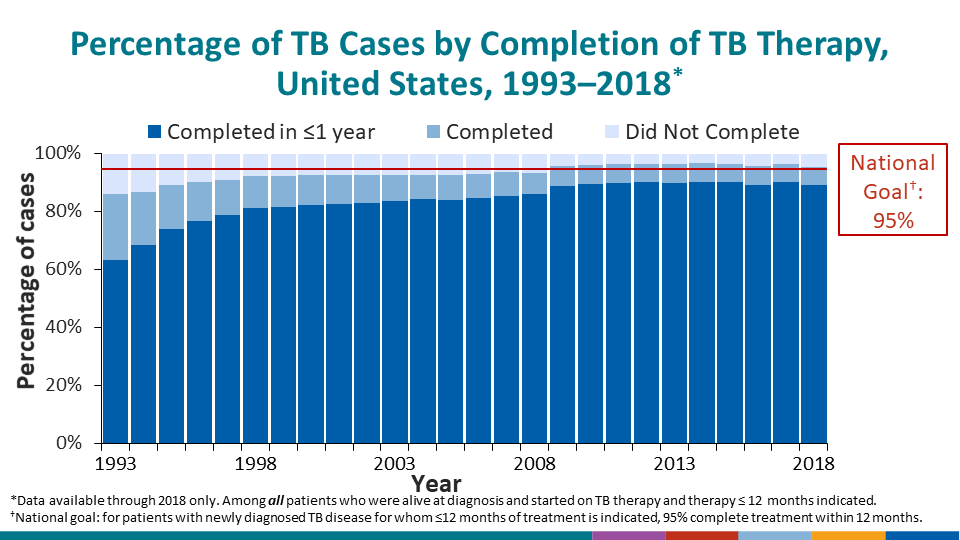
Table 52. Tuberculosis Cases and Percentages Among Persons Completing Therapy for Whom Therapy Was Indicated for ≤1 Year: Reporting Areas, 2014–20181
See Surveillance Slide #53
| Reporting Area | Year | |||||||||
|---|---|---|---|---|---|---|---|---|---|---|
| 2014 | 2015 | 2016 | 2017 | 2018 | ||||||
| No.2 | (%)3 | No.2 | (%)3 | No.2 | (%)3 | No.2 | (%)3 | No.2 | (%)3 | |
| United States | 7,707 | (90.3) | 7,851 | (90.1) | 7,577 | (89.3) | 7,399 | (90.2) | 7,359 | (89.1) |
| Alabama | 112 | (93.8) | 98 | (86.7) | 97 | (87.6) | 107 | (88.8) | 81 | (85.2) |
| Alaska | 54 | (94.4) | 59 | (93.2) | 54 | (88.9) | 47 | (91.5) | 57 | (93.0) |
| Arizona | 127 | (88.2) | 150 | (92.7) | 135 | (87.4) | 146 | (92.5) | 134 | (85.1) |
| Arkansas | 80 | (75.0) | 79 | (84.8) | 70 | (78.6) | 76 | (78.9) | 69 | (76.8) |
| California | 1,745 | (88.3) | 1,763 | (89.1) | 1,647 | (88.3) | 1,661 | (90.2) | 1,713 | (88.2) |
| Colorado | 51 | (96.1) | 61 | (95.1) | 46 | (89.1) | 68 | (91.2) | 58 | (96.6) |
| Connecticut | 51 | (98.0) | 56 | (94.6) | 41 | (97.6) | 49 | (98.0) | 43 | (100.0) |
| Delaware | 21 | (81.0) | 18 | (88.9) | 14 | (100.0) | 9 | (100.0) | 18 | (83.3) |
| District of Columbia | 27 | (92.6) | 24 | (87.5) | 19 | (94.7) | 30 | (76.7) | 27 | (92.6) |
| Florida | 504 | (95.2) | 495 | (95.8) | 535 | (93.1) | 454 | (95.2) | 501 | (97.2) |
| Georgia | 283 | (90.1) | 269 | (90.3) | 244 | (88.9) | 240 | (86.3) | 222 | (92.8) |
| Hawaii | 120 | (98.3) | 113 | (95.6) | 102 | (99.0) | 97 | (96.9) | 101 | (94.1) |
| Idaho | 8 | (75.0) | 9 | (100.0) | 15 | (93.3) | 9 | (88.9) | 8 | (75.0) |
| Illinois | 262 | (90.8) | 289 | (94.5) | 275 | (91.6) | 272 | (92.3) | 257 | (89.5) |
| Indiana | 91 | (92.3) | 101 | (94.1) | 91 | (92.3) | 84 | (96.4) | 96 | (95.8) |
| Iowa | 43 | (90.7) | 34 | (85.3) | 40 | (92.5) | 39 | (97.4) | 42 | (95.2) |
| Kansas | 35 | (94.3) | 32 | (93.8) | 37 | (91.9) | 21 | (100.0) | 23 | (73.9) |
| Kentucky | 62 | (95.2) | 53 | (94.3) | 77 | (96.1) | 49 | (98.0) | 47 | (85.1) |
| Louisiana | 103 | (79.6) | 107 | (72.9) | 112 | (75.9) | 119 | (82.4) | 91 | (75.8) |
| Maine | 14 | (78.6) | 15 | (100.0) | 21 | (95.2) | 9 | (100.0) | 13 | (84.6) |
| Maryland | 162 | (90.1) | 141 | (90.8) | 182 | (93.4) | 172 | (86.0) | 173 | (77.5) |
| Massachusetts | 162 | (88.3) | 151 | (88.7) | 156 | (88.5) | 168 | (94.6) | 169 | (81.7) |
| Michigan | 87 | (95.4) | 112 | (95.5) | 115 | (94.8) | 99 | (96.0) | 85 | (95.3) |
| Minnesota | 122 | (92.6) | 125 | (95.2) | 138 | (94.2) | 138 | (95.7) | 139 | (92.1) |
| Mississippi | 59 | (83.1) | 55 | (89.1) | 47 | (89.4) | 44 | (86.4) | 65 | (93.8) |
| Missouri | 62 | (71.0) | 77 | (81.8) | 90 | (80.0) | 72 | (73.6) | 66 | (74.2) |
| Montana | 3 | (100.0) | 7 | (100.0) | 4 | (100.0) | 3 | (100.0) | 3 | (100.0) |
| Nebraska | 35 | (68.6) | 27 | (37.0) | 25 | (56.0) | 15 | (66.7) | 24 | (79.2) |
| Nevada | 66 | (93.9) | 70 | (95.7) | 43 | (95.3) | 66 | (98.5) | 58 | (100.0) |
| New Hampshire | 10 | (100.0) | 7 | (100.0) | 10 | (100.0) | 17 | (88.2) | 10 | (100.0) |
| New Jersey | 244 | (92.6) | 254 | (90.9) | 242 | (93.8) | 212 | (92.9) | 230 | (91.7) |
| New Mexico | 35 | (94.3) | 29 | (93.1) | 28 | (89.3) | 25 | (96.0) | 34 | (91.2) |
| New York State4 | 167 | (92.2) | 149 | (94.0) | 160 | (95.6) | 161 | (93.2) | 141 | (95.7) |
| New York City | 476 | (95.4) | 489 | (94.1) | 447 | (93.3) | 494 | (92.9) | 447 | (93.1) |
| North Carolina | 159 | (97.5) | 162 | (92.6) | 189 | (91.0) | 185 | (94.6) | 170 | (86.5) |
| North Dakota | 12 | (58.3) | 7 | (85.7) | 21 | (90.5) | 13 | (92.3) | 11 | (81.8) |
| Ohio | 121 | (90.9) | 116 | (83.6) | 118 | (76.3) | 123 | (82.1) | 149 | (85.9) |
| Oklahoma | 53 | (94.3) | 59 | (88.1) | 59 | (94.9) | 48 | (95.8) | 58 | (94.8) |
| Oregon | 58 | (94.8) | 65 | (87.7) | 59 | (79.7) | 61 | (90.2) | 71 | (95.8) |
| Pennsylvania | 165 | (80.6) | 165 | (81.2) | 139 | (78.4) | 156 | (75.6) | 173 | (84.4) |
| Rhode Island | 17 | (88.2) | 23 | (100.0) | 8 | (87.5) | 9 | (77.8) | 14 | (78.6) |
| South Carolina | 65 | (95.4) | 86 | (91.9) | 83 | (94.0) | 87 | (92.0) | 61 | (93.4) |
| South Dakota | 5 | (80.0) | 14 | (50.0) | 9 | (88.9) | 11 | (100.0) | 11 | (72.7) |
| Tennessee | 128 | (95.3) | 106 | (95.3) | 86 | (95.3) | 105 | (95.2) | 108 | (92.6) |
| Texas | 1,025 | (87.7) | 1,085 | (87.5) | 1,043 | (84.8) | 905 | (84.4) | 909 | (85.0) |
| Utah | 23 | (100.0) | 31 | (93.5) | 18 | (94.4) | 24 | (95.8) | 13 | (100.0) |
| Vermont | 2 | (100.0) | 7 | (100.0) | 5 | (100.0) | 2 | (50.0) | 5 | (40.0) |
| Virginia | 170 | (95.9) | 180 | (92.2) | 172 | (92.4) | 176 | (97.2) | 168 | (94.0) |
| Washington | 169 | (89.3) | 161 | (90.1) | 164 | (92.7) | 167 | (93.4) | 152 | (94.1) |
| West Virginia | 12 | (91.7) | 6 | (83.3) | 11 | (81.8) | 13 | (84.6) | 5 | (60.0) |
| Wisconsin | 38 | (89.5) | 58 | (84.5) | 34 | (85.3) | 40 | (90.0) | 35 | (85.7) |
| Wyoming | 2 | (100.0) | 2 | (100.0) | 0 | … | 2 | (100.0) | 1 | (100.0) |
| American Samoa5 | 0 | … | 4 | … | 1 | … | 5 | … | 2 | (50.0) |
| Fed. States of Micronesia5 | 165 | (92.1) | 93 | (90.3) | 124 | (96.0) | 129 | (94.6) | 98 | (90.8) |
| Guam5 | 51 | (94.1) | 66 | (95.5) | 64 | (84.4) | 74 | (91.9) | 62 | (85.5) |
| Marshall Islands5 | 137 | (92.0) | 118 | (87.3) | 157 | (57.3) | 181 | (31.5) | 349 | (67.0) |
| Northern Mariana Islands5 | 16 | (81.3) | 26 | (80.8) | 25 | (92.0) | 39 | (94.9) | 41 | (90.2) |
| Puerto Rico5 | 32 | (90.6) | 38 | (73.7) | 52 | (88.5) | 30 | (73.3) | 19 | (78.9) |
| Palau5 | 7 | (100.0) | 11 | (90.9) | 19 | (84.2) | 16 | (93.8) | 11 | (90.9) |
| U.S. Virgin Islands5 | 0 | … | 0 | … | 0 | … | 4 | 25 | 1 | … |
1Most recent year for which data are available.
2Total cases for which therapy ≤1 year indicated in persons alive at diagnosis with an initial regimen of one or more drugs prescribed who did not die within one year of initiating therapy. Excludes persons with initial isolate rifampin resistant, or patient with bone and joint disease, meningeal disease or disease of the central nervous system, or pediatric patient (age <15) with miliary disease or positive blood culture or a positive nucleic acid amplification test on a blood specimen, and those who moved out of the country within one year of initiating treatment.
3Percentage of total cases in persons who completed therapy within one year for whom therapy ≤1 year was indicated.
4Excludes New York City.
5Not included in U.S. totals.
Note: See Technical Notes for description of completion of therapy calculation.
Ellipses (…) indicate that the percentage cannot be calculated, and the denominator is 0.