Reported Tuberculosis in the United States, 2020
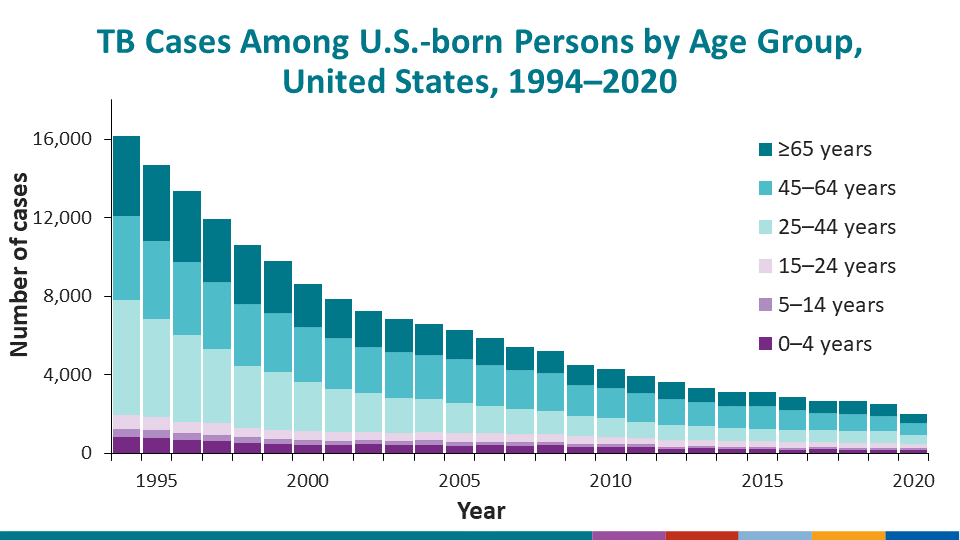
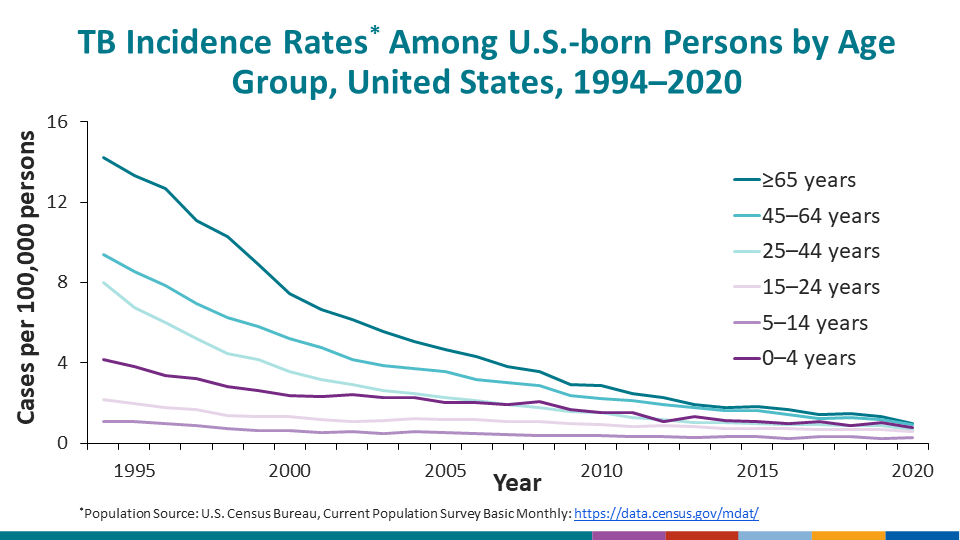
Table 4B. Tuberculosis Cases, Percentages, and Incidence Rates per 100,000 Population Among U.S.-Born Persons by Age Group: United States, 1994–2020
See Surveillance Slides #33 and #34.
| Year | Total Cases | 0─4 | 5─14 | 15─24 | 25─44 | 45─64 | ≥65 | Unknown/Missing | |||||||||||||
|---|---|---|---|---|---|---|---|---|---|---|---|---|---|---|---|---|---|---|---|---|---|
| No. | (%) | Rate | No. | (%) | Rate | No. | (%) | Rate | No. | (%) | Rate | No. | (%) | Rate | No. | (%) | Rate | No. | (%) | ||
| 1994 | 16,182 | 847 | (5.2) | 4.2 | 402 | (2.5) | 1.1 | 721 | (4.5) | 2.2 | 5,863 | (36.2) | 8.0 | 4,266 | (26.4) | 9.4 | 4,078 | (25.2) | 14.2 | 5 | (0.0) |
| 1995 | 14,663 | 767 | (5.2) | 3.8 | 413 | (2.8) | 1.1 | 660 | (4.5) | 2.0 | 4,989 | (34.0) | 6.7 | 3,978 | (27.1) | 8.6 | 3,852 | (26.3) | 13.3 | 4 | (0.0) |
| 1996 | 13,385 | 666 | (5.0) | 3.4 | 373 | (2.8) | 1.0 | 583 | (4.4) | 1.8 | 4,392 | (32.8) | 6.0 | 3,717 | (27.8) | 7.8 | 3,651 | (27.3) | 12.7 | 3 | (0.0) |
| 1997 | 11,926 | 629 | (5.3) | 3.2 | 331 | (2.8) | 0.9 | 563 | (4.7) | 1.7 | 3,784 | (31.7) | 5.2 | 3,412 | (28.6) | 7.0 | 3,207 | (26.9) | 11.1 | 0 | (0.0) |
| 1998 | 10,610 | 541 | (5.1) | 2.8 | 276 | (2.6) | 0.7 | 467 | (4.4) | 1.4 | 3,178 | (30.0) | 4.5 | 3,151 | (29.7) | 6.3 | 2,997 | (28.2) | 10.3 | 0 | (0.0) |
| 1999 | 9,784 | 503 | (5.1) | 2.6 | 254 | (2.6) | 0.7 | 447 | (4.6) | 1.3 | 2,942 | (30.1) | 4.2 | 3,015 | (30.8) | 5.8 | 2,621 | (26.8) | 8.9 | 2 | (0.0) |
| 2000 | 8,632 | 453 | (5.2) | 2.3 | 251 | (2.9) | 0.6 | 461 | (5.3) | 1.3 | 2,476 | (28.7) | 3.6 | 2,785 | (32.3) | 5.2 | 2,206 | (25.6) | 7.5 | 0 | (0.0) |
| 2001 | 7,849 | 444 | (5.7) | 2.3 | 211 | (2.7) | 0.5 | 414 | (5.3) | 1.2 | 2,190 | (27.9) | 3.2 | 2,621 | (33.4) | 4.8 | 1,969 | (25.1) | 6.6 | 0 | (0.0) |
| 2002 | 7,265 | 470 | (6.5) | 2.4 | 218 | (3.0) | 0.6 | 380 | (5.2) | 1.1 | 1,990 | (27.4) | 2.9 | 2,382 | (32.8) | 4.2 | 1,825 | (25.1) | 6.2 | 0 | (0.0) |
| 2003 | 6,843 | 446 | (6.5) | 2.3 | 196 | (2.9) | 0.5 | 403 | (5.9) | 1.1 | 1,765 | (25.8) | 2.6 | 2,332 | (34.1) | 3.9 | 1,701 | (24.9) | 5.5 | 0 | (0.0) |
| 2004 | 6,601 | 448 | (6.8) | 2.3 | 220 | (3.3) | 0.6 | 441 | (6.7) | 1.2 | 1,639 | (24.8) | 2.4 | 2,288 | (34.7) | 3.7 | 1,565 | (23.7) | 5.1 | 0 | (0.0) |
| 2005 | 6,288 | 401 | (6.4) | 2.0 | 205 | (3.3) | 0.5 | 434 | (6.9) | 1.2 | 1,530 | (24.3) | 2.3 | 2,260 | (35.9) | 3.6 | 1,458 | (23.2) | 4.6 | 0 | (0.0) |
| 2006 | 5,858 | 409 | (7.0) | 2.0 | 191 | (3.3) | 0.5 | 423 | (7.2) | 1.2 | 1,415 | (24.2) | 2.1 | 2,063 | (35.2) | 3.2 | 1,357 | (23.2) | 4.3 | 0 | (0.0) |
| 2007 | 5,440 | 395 | (7.3) | 1.9 | 171 | (3.1) | 0.4 | 407 | (7.5) | 1.1 | 1,271 | (23.4) | 1.9 | 1,979 | (36.4) | 3.0 | 1,216 | (22.4) | 3.8 | 1 | (0.0) |
| 2008 | 5,237 | 430 | (8.2) | 2.1 | 148 | (2.8) | 0.4 | 406 | (7.8) | 1.1 | 1,163 | (22.2) | 1.8 | 1,928 | (36.8) | 2.9 | 1,162 | (22.2) | 3.5 | 0 | (0.0) |
| 2009 | 4,490 | 351 | (7.8) | 1.7 | 149 | (3.3) | 0.4 | 376 | (8.4) | 1.0 | 1,016 | (22.6) | 1.6 | 1,616 | (36.0) | 2.4 | 982 | (21.9) | 2.9 | 0 | (0.0) |
| 2010 | 4,309 | 322 | (7.5) | 1.5 | 156 | (3.6) | 0.4 | 357 | (8.3) | 0.9 | 975 | (22.6) | 1.5 | 1,533 | (35.6) | 2.2 | 966 | (22.4) | 2.9 | 0 | (0.0) |
| 2011 | 3,922 | 317 | (8.1) | 1.5 | 138 | (3.5) | 0.3 | 312 | (8.0) | 0.8 | 835 | (21.3) | 1.3 | 1,454 | (37.1) | 2.1 | 866 | (22.1) | 2.5 | 0 | (0.0) |
| 2012 | 3,617 | 218 | (6.0) | 1.1 | 132 | (3.6) | 0.3 | 345 | (9.5) | 0.9 | 745 | (20.6) | 1.2 | 1,336 | (36.9) | 1.9 | 841 | (23.3) | 2.3 | 0 | (0.0) |
| 2013 | 3,320 | 262 | (7.9) | 1.3 | 120 | (3.6) | 0.3 | 318 | (9.6) | 0.8 | 679 | (20.5) | 1.0 | 1,214 | (36.6) | 1.8 | 727 | (21.9) | 1.9 | 0 | (0.0) |
| 2014 | 3,113 | 224 | (7.2) | 1.1 | 123 | (4.0) | 0.3 | 291 | (9.3) | 0.7 | 657 | (21.1) | 1.0 | 1,123 | (36.1) | 1.6 | 695 | (22.3) | 1.8 | 0 | (0.0) |
| 2015 | 3,126 | 210 | (6.7) | 1.1 | 130 | (4.2) | 0.3 | 287 | (9.2) | 0.7 | 638 | (20.4) | 1.0 | 1,126 | (36.0) | 1.6 | 735 | (23.5) | 1.8 | 0 | (0.0) |
| 2016 | 2,884 | 191 | (6.6) | 1.0 | 95 | (3.3) | 0.2 | 276 | (9.6) | 0.7 | 621 | (21.5) | 0.9 | 1,002 | (34.7) | 1.4 | 698 | (24.2) | 1.7 | 1 | (0.0) |
| 2017 | 2,666 | 206 | (7.7) | 1.1 | 128 | (4.8) | 0.3 | 253 | (9.5) | 0.7 | 607 | (22.8) | 0.9 | 846 | (31.7) | 1.2 | 626 | (23.5) | 1.4 | 0 | (0.0) |
| 2018 | 2,647 | 168 | (6.3) | 0.9 | 122 | (4.6) | 0.3 | 256 | (9.7) | 0.7 | 581 | (21.9) | 0.9 | 858 | (32.4) | 1.3 | 661 | (25.0) | 1.5 | 1 | (0.0) |
| 2019 | 2,530 | 197 | (7.8) | 1.0 | 96 | (3.8) | 0.2 | 256 | (10.1) | 0.7 | 602 | (23.8) | 0.9 | 779 | (30.8) | 1.2 | 600 | (23.7) | 1.3 | 0 | (0.0) |
| 2020 | 2,018 | 152 | (7.5) | 0.8 | 102 | (5.1) | 0.3 | 214 | (10.6) | 0.6 | 484 | (24.0) | 0.7 | 605 | (30.0) | 0.9 | 460 | (22.8) | 1.0 | 1 | (0.0) |
Note: Incidence rates were created using Current Population Survey (CPS) Basic Monthly data set, obtained from https://data.census.gov/mdat/#/. The CPS does not include institutionalized persons.
Data for all years updated through June 14, 2021.
Zero % (0.0) denotes <0.05%.