Reported Tuberculosis in the United States, 2020
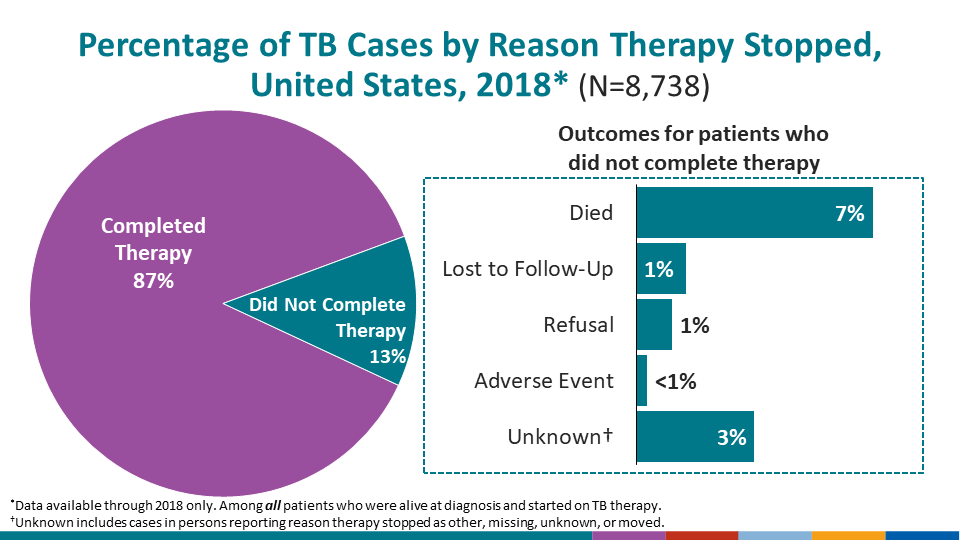
Table 49. Tuberculosis Cases and Percentages, by Reason Therapy Was Stopped: Reporting Areas, 20181
See Surveillance Slide #54
| Reporting Area | Cases with Initial Drug Regimen Prescribed2 | Completed Therapy | Did Not Complete Therapy | ||||||||||
|---|---|---|---|---|---|---|---|---|---|---|---|---|---|
| Adverse Event | Lost | Refused | Died3 | Unknown4 | |||||||||
| No. | (%) | No. | (%) | No. | (%) | No. | (%) | No. | (%) | No. | (%) | ||
| United States | 8,738 | 7,640 | (87.4) | 25 | (0.3) | 119 | (1.4) | 85 | (1.0) | 578 | (6.6) | 291 | (3.3) |
| Alabama | 89 | 78 | (87.6) | 0 | (0.0) | 4 | (4.5) | 1 | (1.1) | 4 | (4.5) | 2 | (2.2) |
| Alaska | 61 | 57 | (93.4) | 0 | (0.0) | 0 | (0.0) | 1 | (1.6) | 0 | (0.0) | 3 | (4.9) |
| Arizona | 176 | 154 | (87.5) | 0 | (0.0) | 3 | (1.7) | 5 | (2.8) | 8 | (4.5) | 6 | (3.4) |
| Arkansas | 72 | 62 | (86.1) | 1 | (1.4) | 1 | (1.4) | 3 | (4.2) | 1 | (1.4) | 4 | (5.6) |
| California | 2,034 | 1,763 | (86.7) | 7 | (0.3) | 25 | (1.2) | 13 | (0.6) | 160 | (7.9) | 66 | (3.2) |
| Colorado | 63 | 61 | (96.8) | 0 | (0.0) | 0 | (0.0) | 0 | (0.0) | 1 | (1.6) | 1 | (1.6) |
| Connecticut | 50 | 46 | (92.0) | 0 | (0.0) | 0 | (0.0) | 0 | (0.0) | 2 | (4.0) | 2 | (4.0) |
| Delaware | 21 | 17 | (81.0) | 0 | (0.0) | 0 | (0.0) | 1 | (4.8) | 1 | (4.8) | 2 | (9.5) |
| District of Columbia | 33 | 27 | (81.8) | 0 | (0.0) | 0 | (0.0) | 0 | (0.0) | 0 | (0.0) | 6 | (18.2) |
| Florida | 577 | 521 | (90.3) | 0 | (0.0) | 2 | (0.3) | 1 | (0.2) | 42 | (7.3) | 11 | (1.9) |
| Georgia | 258 | 236 | (91.5) | 0 | (0.0) | 4 | (1.6) | 1 | (0.4) | 11 | (4.3) | 6 | (2.3) |
| Hawaii | 117 | 104 | (88.9) | 0 | (0.0) | 0 | (0.0) | 0 | (0.0) | 13 | (11.1) | 0 | (0.0) |
| Idaho | 13 | 11 | (84.6) | 0 | (0.0) | 0 | (0.0) | 0 | (0.0) | 1 | (7.7) | 1 | (7.7) |
| Illinois | 311 | 272 | (87.5) | 2 | (0.6) | 3 | (1.0) | 4 | (1.3) | 24 | (7.7) | 6 | (1.9) |
| Indiana | 113 | 103 | (91.2) | 0 | (0.0) | 1 | (0.9) | 0 | (0.0) | 9 | (8.0) | 0 | (0.0) |
| Iowa | 46 | 46 | (100.0) | 0 | (0.0) | 0 | (0.0) | 0 | (0.0) | 0 | (0.0) | 0 | (0.0) |
| Kansas | 28 | 19 | (67.9) | 0 | (0.0) | 0 | (0.0) | 0 | (0.0) | 1 | (3.6) | 8 | (28.6) |
| Kentucky | 60 | 48 | (80.0) | 1 | (1.7) | 2 | (3.3) | 0 | (0.0) | 8 | (13.3) | 1 | (1.7) |
| Louisiana | 103 | 86 | (83.5) | 1 | (1.0) | 4 | (3.9) | 4 | (3.9) | 6 | (5.8) | 2 | (1.9) |
| Maine | 14 | 12 | (85.7) | 0 | (0.0) | 1 | (7.1) | 0 | (0.0) | 0 | (0.0) | 1 | (7.1) |
| Maryland | 203 | 171 | (84.2) | 2 | (1.0) | 4 | (2.0) | 1 | (0.5) | 9 | (4.4) | 16 | (7.9) |
| Massachusetts | 194 | 172 | (88.7) | 1 | (0.5) | 2 | (1.0) | 0 | (0.0) | 7 | (3.6) | 12 | (6.2) |
| Michigan | 105 | 92 | (87.6) | 0 | (0.0) | 3 | (2.9) | 0 | (0.0) | 10 | (9.5) | 0 | (0.0) |
| Minnesota | 170 | 163 | (95.9) | 0 | (0.0) | 1 | (0.6) | 3 | (1.8) | 2 | (1.2) | 1 | (0.6) |
| Mississippi | 72 | 64 | (88.9) | 0 | (0.0) | 1 | (1.4) | 0 | (0.0) | 5 | (6.9) | 2 | (2.8) |
| Missouri | 76 | 57 | (75.0) | 1 | (1.3) | 2 | (2.6) | 4 | (5.3) | 3 | (3.9) | 9 | (11.8) |
| Montana | 5 | 4 | (80.0) | 0 | (0.0) | 0 | (0.0) | 0 | (0.0) | 1 | (20.0) | 0 | (0.0) |
| Nebraska | 27 | 22 | (81.5) | 1 | (3.7) | 0 | (0.0) | 0 | (0.0) | 1 | (3.7) | 3 | (11.1) |
| Nevada | 67 | 63 | (94.0) | 0 | (0.0) | 1 | (1.5) | 0 | (0.0) | 3 | (4.5) | 0 | (0.0) |
| New Hampshire | 12 | 11 | (91.7) | 0 | (0.0) | 0 | (0.0) | 0 | (0.0) | 1 | (8.3) | 0 | (0.0) |
| New Jersey | 285 | 248 | (87.0) | 1 | (0.4) | 3 | (1.1) | 1 | (0.4) | 25 | (8.8) | 7 | (2.5) |
| New Mexico | 39 | 35 | (89.7) | 0 | (0.0) | 1 | (2.6) | 0 | (0.0) | 1 | (2.6) | 2 | (5.1) |
| New York State5 | 189 | 166 | (87.8) | 0 | (0.0) | 2 | (1.1) | 1 | (0.5) | 12 | (6.3) | 8 | (4.2) |
| New York City | 539 | 477 | (88.5) | 0 | (0.0) | 9 | (1.7) | 9 | (1.7) | 36 | (6.7) | 8 | (1.5) |
| North Carolina | 191 | 169 | (88.5) | 1 | (0.5) | 4 | (2.1) | 0 | (0.0) | 15 | (7.9) | 2 | (1.0) |
| North Dakota | 13 | 12 | (92.3) | 0 | (0.0) | 0 | (0.0) | 0 | (0.0) | 1 | (7.7) | 0 | (0.0) |
| Ohio | 173 | 154 | (89.0) | 0 | (0.0) | 1 | (0.6) | 1 | (0.6) | 7 | (4.0) | 10 | (5.8) |
| Oklahoma | 70 | 64 | (91.4) | 0 | (0.0) | 1 | (1.4) | 1 | (1.4) | 4 | (5.7) | 0 | (0.0) |
| Oregon | 80 | 77 | (96.3) | 0 | (0.0) | 0 | (0.0) | 0 | (0.0) | 2 | (2.5) | 1 | (1.3) |
| Pennsylvania | 204 | 177 | (86.8) | 0 | (0.0) | 5 | (2.5) | 3 | (1.5) | 12 | (5.9) | 7 | (3.4) |
| Rhode Island | 20 | 17 | (85.0) | 0 | (0.0) | 0 | (0.0) | 0 | (0.0) | 1 | (5.0) | 2 | (10.0) |
| South Carolina | 82 | 67 | (81.7) | 0 | (0.0) | 0 | (0.0) | 0 | (0.0) | 15 | (18.3) | 0 | (0.0) |
| South Dakota | 11 | 9 | (81.8) | 1 | (9.1) | 0 | (0.0) | 0 | (0.0) | 0 | (0.0) | 1 | (9.1) |
| Tennessee | 133 | 109 | (82.0) | 1 | (0.8) | 4 | (3.0) | 2 | (1.5) | 11 | (8.3) | 6 | (4.5) |
| Texas | 1,079 | 906 | (84.0) | 2 | (0.2) | 23 | (2.1) | 21 | (1.9) | 72 | (6.7) | 55 | (5.1) |
| Utah | 18 | 17 | (94.4) | 0 | (0.0) | 0 | (0.0) | 0 | (0.0) | 1 | (5.6) | 0 | (0.0) |
| Vermont | 5 | 2 | (40.0) | 1 | (20.0) | 0 | (0.0) | 0 | (0.0) | 0 | (0.0) | 2 | (40.0) |
| Virginia | 199 | 180 | (90.5) | 0 | (0.0) | 0 | (0.0) | 3 | (1.5) | 12 | (6.0) | 4 | (2.0) |
| Washington | 185 | 167 | (90.3) | 1 | (0.5) | 2 | (1.1) | 0 | (0.0) | 10 | (5.4) | 5 | (2.7) |
| West Virginia | 6 | 4 | (66.7) | 0 | (0.0) | 0 | (0.0) | 1 | (16.7) | 1 | (16.7) | 0 | (0.0) |
| Wisconsin | 46 | 40 | (87.0) | 0 | (0.0) | 0 | (0.0) | 0 | (0.0) | 6 | (13.0) | 0 | (0.0) |
| Wyoming | 1 | 1 | (100.0) | 0 | (0.0) | 0 | (0.0) | 0 | (0.0) | 0 | (0.0) | 0 | (0.0) |
| American Samoa6 | 2 | 1 | (50.0) | 0 | (0.0) | 0 | (0.0) | 0 | (0.0) | 0 | (0.0) | 1 | (50.0) |
| Fed. States of Micronesia6 | 104 | 96 | (92.3) | 0 | (0.0) | 4 | (3.8) | 0 | (0.0) | 1 | (1.0) | 3 | (2.9) |
| Guam6 | 68 | 57 | (83.8) | 0 | (0.0) | 2 | (2.9) | 2 | (2.9) | 3 | (4.4) | 4 | (5.9) |
| Marshall Islands6 | 360 | 244 | (67.8) | 0 | (0.0) | 15 | (4.2) | 1 | (0.3) | 8 | (2.2) | 92 | (25.6) |
| Northern Mariana Islands6 | 47 | 39 | (83.0) | 0 | (0.0) | 0 | (0.0) | 2 | (4.3) | 3 | (6.4) | 3 | (6.4) |
| Puerto Rico6 | 27 | 20 | (74.1) | 0 | (0.0) | 0 | (0.0) | 2 | (7.4) | 5 | (18.5) | 0 | (0.0) |
| Palau6 | 15 | 12 | (80.0) | 0 | (0.0) | 0 | (0.0) | 0 | (0.0) | 2 | (13.3) | 1 | (6.7) |
| U.S. Virgin Islands6 | 1 | 0 | (0.0) | 0 | (0.0) | 0 | (0.0) | 0 | (0.0) | 0 | (0.0) | 1 | (100.0) |
1Most recent year for which data are available.
2Number of cases in persons alive at diagnosis, with an initial regimen of one or more drugs prescribed. Percentage for U.S. based on 52 reporting areas (50 states, New York City, and the District of Columbia).
3Died = died of any cause.
4Includes cases reported as other, missing, or unknown.
5Excludes New York City.
6Not included in U.S. totals.