Reported Tuberculosis in the United States, 2020
Table 48. Tuberculosis Cases and Percentages, by Directly Observed Therapy (DOT): Reporting Areas, 20181
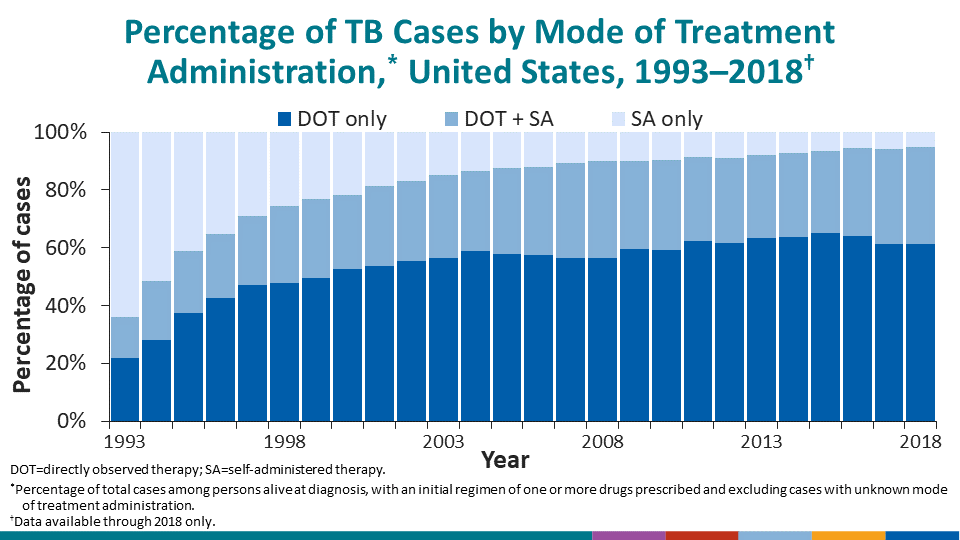
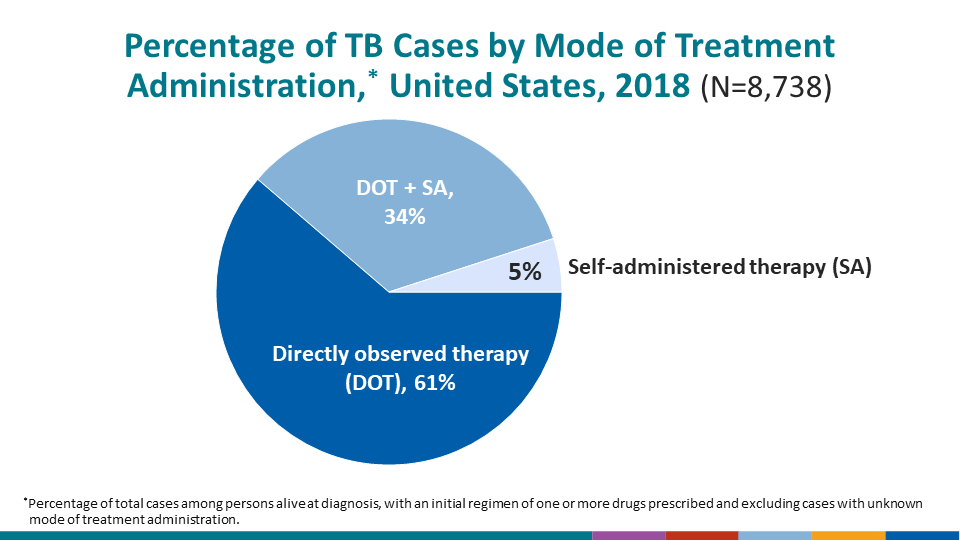
See Surveillance Slides #51 and #52.
| Reporting Area | Total Cases | Cases with Initial Drug Regimen Prescribed2 | Cases with Information on Directly Observed Therapy | Percentage of Cases by Directly Observed Therapy3 | ||
|---|---|---|---|---|---|---|
| No. | (%) | DOT Only | Both DOT and Self-Administered | |||
| United States | 9,006 | 8,738 | 8,578 | (98.2) | (61.3) | (33.7) |
| Alabama | 91 | 89 | 88 | (98.9) | (44.3) | (55.7) |
| Alaska | 63 | 61 | 59 | (96.7) | (96.6) | (3.4) |
| Arizona | 178 | 176 | 176 | (100.0) | (84.7) | (14.8) |
| Arkansas | 76 | 72 | 68 | (94.4) | (91.2) | (7.4) |
| California | 2,097 | 2,034 | 2,012 | (98.9) | (46.9) | (48.2) |
| Colorado | 64 | 63 | 63 | (100.0) | (81.0) | (7.9) |
| Connecticut | 51 | 50 | 50 | (100.0) | (8.0) | (86.0) |
| Delaware | 22 | 21 | 19 | (90.5) | (47.4) | (52.6) |
| District of Columbia | 36 | 33 | 33 | (100.0) | (84.8) | (0.0) |
| Florida | 591 | 577 | 573 | (99.3) | (14.1) | (84.8) |
| Georgia | 270 | 258 | 255 | (98.8) | (82.4) | (16.5) |
| Hawaii | 120 | 117 | 115 | (98.3) | (96.5) | (1.7) |
| Idaho | 15 | 13 | 13 | (100.0) | (23.1) | (53.8) |
| Illinois | 319 | 311 | 311 | (100.0) | (63.7) | (30.2) |
| Indiana | 116 | 113 | 113 | (100.0) | (73.5) | (26.5) |
| Iowa | 49 | 46 | 46 | (100.0) | (82.6) | (17.4) |
| Kansas | 28 | 28 | 20 | (71.4) | (85.0) | (15.0) |
| Kentucky | 65 | 60 | 60 | (100.0) | (98.3) | (1.7) |
| Louisiana | 105 | 103 | 103 | (100.0) | (58.3) | (20.4) |
| Maine | 14 | 14 | 13 | (92.9) | (46.2) | (46.2) |
| Maryland | 208 | 203 | 199 | (98.0) | (66.3) | (33.7) |
| Massachusetts | 200 | 194 | 173 | (89.2) | (71.7) | (20.8) |
| Michigan | 108 | 105 | 101 | (96.2) | (88.1) | (11.9) |
| Minnesota | 172 | 170 | 169 | (99.4) | (36.1) | (62.7) |
| Mississippi | 80 | 72 | 71 | (98.6) | (63.4) | (36.6) |
| Missouri | 80 | 76 | 68 | (89.5) | (22.1) | (76.5) |
| Montana | 5 | 5 | 5 | (100.0) | (0.0) | (100.0) |
| Nebraska | 27 | 27 | 23 | (85.2) | (4.3) | (87.0) |
| Nevada | 69 | 67 | 67 | (100.0) | (34.3) | (65.7) |
| New Hampshire | 12 | 12 | 12 | (100.0) | (75.0) | (25.0) |
| New Jersey | 291 | 285 | 283 | (99.3) | (55.1) | (27.9) |
| New Mexico | 39 | 39 | 39 | (100.0) | (94.9) | (5.1) |
| New York State4 | 191 | 189 | 186 | (98.4) | (18.8) | (76.3) |
| New York City | 553 | 539 | 497 | (92.2) | (56.7) | (17.9) |
| North Carolina | 196 | 191 | 190 | (99.5) | (95.3) | (4.7) |
| North Dakota | 13 | 13 | 13 | (100.0) | (84.6) | (15.4) |
| Ohio | 178 | 173 | 173 | (100.0) | (80.9) | (12.7) |
| Oklahoma | 74 | 70 | 70 | (100.0) | (14.3) | (84.3) |
| Oregon | 81 | 80 | 80 | (100.0) | (92.5) | (6.3) |
| Pennsylvania | 213 | 204 | 204 | (100.0) | (74.5) | (25.0) |
| Rhode Island | 20 | 20 | 20 | (100.0) | (10.0) | (90.0) |
| South Carolina | 86 | 82 | 82 | (100.0) | (63.4) | (35.4) |
| South Dakota | 12 | 11 | 11 | (100.0) | (36.4) | (63.6) |
| Tennessee | 139 | 133 | 133 | (100.0) | (97.7) | (2.3) |
| Texas | 1,116 | 1,079 | 1,061 | (98.3) | (87.5) | (11.3) |
| Utah | 18 | 18 | 18 | (100.0) | (83.3) | (16.7) |
| Vermont | 5 | 5 | 4 | (80.0) | (0.0) | (75.0) |
| Virginia | 204 | 199 | 198 | (99.5) | (89.4) | (9.6) |
| Washington | 190 | 185 | 185 | (100.0) | (63.8) | (20.5) |
| West Virginia | 6 | 6 | 6 | (100.0) | (83.3) | (16.7) |
| Wisconsin | 49 | 46 | 46 | (100.0) | (82.6) | (17.4) |
| Wyoming | 1 | 1 | 1 | (100.0) | (0.0) | (100.0) |
| American Samoa5 | 2 | 2 | 0 | (0.0) | … | … |
| Fed. States of Micronesia5 | 104 | 104 | 102 | (98.1) | (88.2) | (9.8) |
| Guam5 | 71 | 68 | 68 | (100.0) | (7.4) | (92.6) |
| Marshall Islands5 | 367 | 360 | 253 | (70.3) | (17.8) | (81.8) |
| Northern Mariana Islands5 | 47 | 47 | 46 | (97.9) | (54.3) | (45.7) |
| Puerto Rico5 | 28 | 27 | 27 | (100.0) | (59.3) | (0.0) |
| Palau5 | 17 | 15 | 14 | (93.3) | (28.6) | (71.4) |
| U.S. Virgin Islands5 | 1 | 1 | 1 | (100.0) | (0.0) | (100.0) |
1Most recent year for which data are available.
2Includes persons alive at diagnosis with an initial drug regimen of one or more drugs prescribed.
3Percentage for U.S. based on 52 reporting areas (50 states, New York City, and the District of Columbia).
4Excludes New York City.
5Not included in U.S. totals.
Ellipses (…) indicate that the percentage cannot be calculated, and the denominator is 0.