Reported Tuberculosis in the United States, 2020
Table 44. Tuberculosis Cases and Percentages, by Initial Drug Regimen: Reporting Areas, 2020
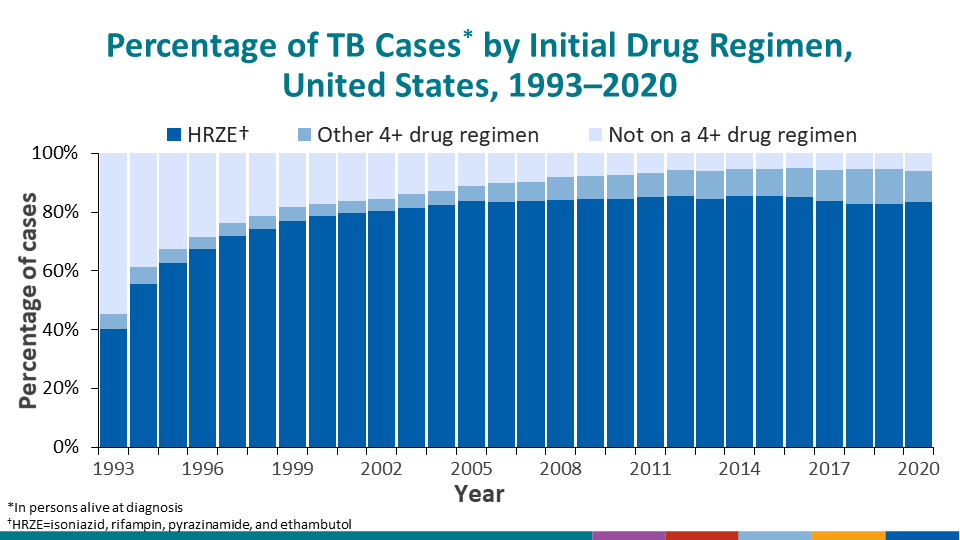
See Surveillance Slides #49 and #50.
| Reporting Area | Total Cases | Cases in Persons Alive at Diagnosis | Cases with Information on Initial Drug Regimen1 | Percentage of Cases in Persons with Initial Drug Regimen2 | ||
|---|---|---|---|---|---|---|
| No. | (%) | Multi (4+) Drug Regimen2 | HRZE3 | |||
| United States | 7,174 | 6,968 | 6,954 | (99.8) | (10.7) | (83.3) |
| Alabama | 73 | 72 | 71 | (98.6) | (19.7) | (76.1) |
| Alaska | 58 | 55 | 55 | (100.0) | (5.5) | (89.1) |
| Arizona | 136 | 132 | 132 | (100.0) | (6.1) | (91.7) |
| Arkansas | 59 | 56 | 53 | (94.6) | (3.8) | (88.7) |
| California | 1,705 | 1,657 | 1,657 | (100.0) | (8.9) | (83.2) |
| Colorado | 52 | 49 | 49 | (100.0) | (6.1) | (81.6) |
| Connecticut | 54 | 54 | 54 | (100.0) | (24.1) | (74.1) |
| Delaware | 17 | 17 | 17 | (100.0) | (58.8) | (41.2) |
| District of Columbia | 19 | 18 | 18 | (100.0) | (0.0) | (100.0) |
| Florida | 412 | 403 | 403 | (100.0) | (6.0) | (86.8) |
| Georgia | 221 | 209 | 209 | (100.0) | (60.8) | (33.0) |
| Hawaii | 92 | 91 | 91 | (100.0) | (16.5) | (81.3) |
| Idaho | 8 | 8 | 8 | (100.0) | (25.0) | (75.0) |
| Illinois | 216 | 206 | 206 | (100.0) | (4.4) | (87.4) |
| Indiana | 92 | 91 | 91 | (100.0) | (3.3) | (95.6) |
| Iowa | 39 | 39 | 39 | (100.0) | (2.6) | (94.9) |
| Kansas | 37 | 34 | 34 | (100.0) | (2.9) | (91.2) |
| Kentucky | 67 | 67 | 67 | (100.0) | (16.4) | (77.6) |
| Louisiana | 99 | 97 | 96 | (99.0) | (4.2) | (88.5) |
| Maine | 17 | 17 | 17 | (100.0) | (0.0) | (94.1) |
| Maryland | 149 | 147 | 147 | (100.0) | (10.2) | (85.0) |
| Massachusetts | 142 | 139 | 139 | (100.0) | (16.5) | (74.1) |
| Michigan | 101 | 98 | 96 | (98.0) | (4.2) | (91.7) |
| Minnesota | 117 | 114 | 114 | (100.0) | (5.3) | (84.2) |
| Mississippi | 41 | 39 | 38 | (97.4) | (5.3) | (84.2) |
| Missouri | 72 | 69 | 69 | (100.0) | (7.2) | (85.5) |
| Montana | 4 | 4 | 4 | (100.0) | (25.0) | (50.0) |
| Nebraska | 36 | 35 | 35 | (100.0) | (22.9) | (60.0) |
| Nevada | 57 | 53 | 53 | (100.0) | (5.7) | (92.5) |
| New Hampshire | 12 | 12 | 12 | (100.0) | (8.3) | (83.3) |
| New Jersey | 245 | 235 | 235 | (100.0) | (3.4) | (93.2) |
| New Mexico | 29 | 26 | 25 | (96.2) | (4.0) | (80.0) |
| New York State4 | 161 | 158 | 158 | (100.0) | (5.7) | (91.8) |
| New York City | 445 | 433 | 433 | (100.0) | (12.5) | (84.1) |
| North Carolina | 159 | 151 | 151 | (100.0) | (19.2) | (80.1) |
| North Dakota | 10 | 10 | 10 | (100.0) | (30.0) | (70.0) |
| Ohio | 130 | 128 | 128 | (100.0) | (19.5) | (71.1) |
| Oklahoma | 67 | 62 | 60 | (96.8) | (8.3) | (78.3) |
| Oregon | 67 | 67 | 67 | (100.0) | (7.5) | (88.1) |
| Pennsylvania | 157 | 150 | 149 | (99.3) | (10.1) | (86.6) |
| Rhode Island | 8 | 8 | 8 | (100.0) | (37.5) | (62.5) |
| South Carolina | 67 | 62 | 62 | (100.0) | (6.5) | (87.1) |
| South Dakota | 16 | 16 | 15 | (93.8) | (20.0) | (80.0) |
| Tennessee | 113 | 110 | 109 | (99.1) | (8.3) | (88.1) |
| Texas | 884 | 863 | 863 | (100.0) | (6.5) | (86.4) |
| Utah | 29 | 28 | 28 | (100.0) | (0.0) | (92.9) |
| Vermont | 3 | 3 | 3 | (100.0) | (0.0) | (66.7) |
| Virginia | 169 | 168 | 168 | (100.0) | (9.5) | (89.9) |
| Washington | 163 | 160 | 160 | (100.0) | (16.9) | (80.6) |
| West Virginia | 13 | 13 | 13 | (100.0) | (0.0) | (100.0) |
| Wisconsin | 35 | 35 | 35 | (100.0) | (11.4) | (82.9) |
| Wyoming | 0 | 0 | 0 | … | … | … |
| American Samoa5 | 3 | 3 | 3 | (100.0) | (100.0) | (0.0) |
| Fed. States of Micronesia5 | 84 | 83 | 82 | (98.8) | (2.4) | (97.6) |
| Guam5 | 57 | 54 | 53 | (98.1) | (3.8) | (94.3) |
| Marshall Islands5 | 149 | 148 | 145 | (98.0) | (0.0) | (100.0) |
| Northern Mariana Islands5 | 39 | 39 | 39 | (100.0) | (17.9) | (79.5) |
| Puerto Rico5 | 27 | 27 | 27 | (100.0) | (3.7) | (92.6) |
| Palau5 | 9 | 9 | 8 | (88.9) | (75.0) | (25.0) |
| U.S. Virgin Islands5 | 4 | 4 | 4 | (100.0) | (75.0) | (25.0) |
1Includes persons who were alive at diagnosis and did not have an unknown drug regimen.
2Indicates at least a four drug regimen that is not HRZE only
3H, isoniazid; R, rifampin; Z, pyrazinamide; E, ethambutol. Cases with other drugs prescribed in addition to these drugs are excluded.
4Excludes New York City.
5Not included in U.S. totals.
Note: In 2020, 64 (0.9%) received no initial drug therapy and 8 (0.1%) were started on one drug in the 50 U.S. states, New York City, and District of Columbia. Of 363 persons who received <4 drug regimen: top 5 regimens were 32.2% HRZ, 25.9% HRE, 6.3% HZE, 5.2% HR, and 4.7% RZE.
Ellipses (…) indicate that the percentage cannot be calculated, and the denominator is 0.