Reported Tuberculosis in the United States, 2020
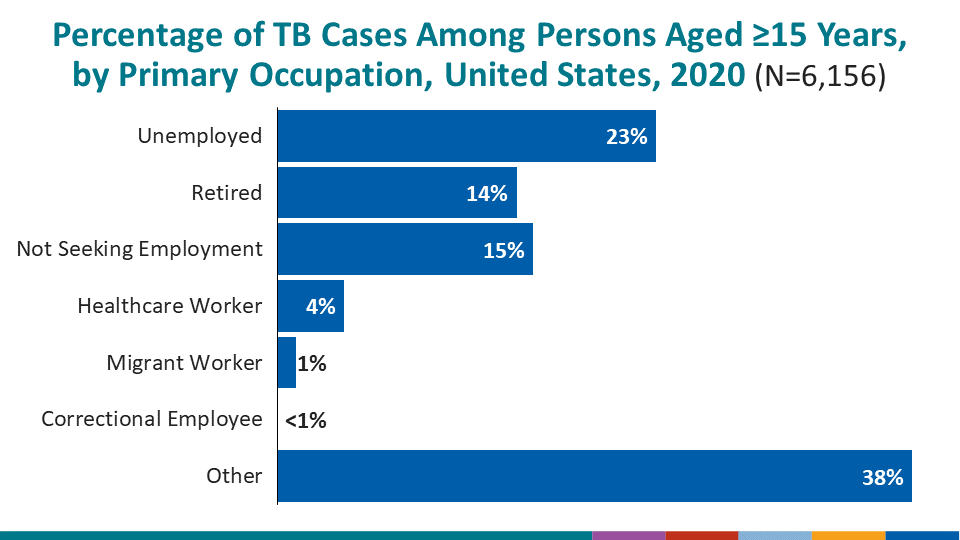
Table 43. Tuberculosis Cases and Percentages, by Primary Occupation, Ages ≥15 Years: Reporting Areas, 2020
See Surveillance Slide #63
| Reporting Area | Total Cases | Occupation | Percentage of Cases by Occupation1 | |||||||
|---|---|---|---|---|---|---|---|---|---|---|
| No. | (%) | Unemployed | Healthcare Worker | Correctional Employee | Migrant worker | Retired | Not Seeking Employment | Other | ||
| United States | 6,856 | 6,156 | (89.8) | (22.8) | (4.0) | (0.0) | (1.1) | (18.4) | (15.4) | (38.2) |
| Alabama | 69 | 69 | (100.0) | (18.8) | (2.9) | (0.0) | (1.4) | (17.4) | (27.5) | (31.9) |
| Alaska | 47 | 44 | (93.6) | (18.2) | (0.0) | (0.0) | (6.8) | (9.1) | (29.5) | (36.4) |
| Arizona | 128 | 0 | (0.0) | … | … | … | … | … | … | … |
| Arkansas | 53 | 53 | (100.0) | (24.5) | (7.5) | (0.0) | (0.0) | (22.6) | (15.1) | (30.2) |
| California | 1,658 | 1,607 | (96.9) | (17.1) | (4.2) | (0.1) | (2.3) | (28.0) | (17.2) | (31.1) |
| Colorado | 47 | 47 | (100.0) | (4.3) | (2.1) | (0.0) | (0.0) | (17.0) | (23.4) | (53.2) |
| Connecticut | 52 | 51 | (98.1) | (13.7) | (11.8) | (0.0) | (0.0) | (13.7) | (27.5) | (33.3) |
| Delaware | 16 | 14 | (87.5) | (14.3) | (7.1) | (0.0) | (0.0) | (7.1) | (14.3) | (57.1) |
| District of Columbia | 19 | 19 | (100.0) | (78.9) | (5.3) | (0.0) | (0.0) | (0.0) | (0.0) | (15.8) |
| Florida | 399 | 362 | (90.7) | (60.2) | (2.2) | (0.0) | (0.8) | (3.6) | (1.7) | (31.5) |
| Georgia | 211 | 192 | (91.0) | (34.4) | (2.1) | (0.0) | (2.1) | (8.3) | (3.6) | (49.5) |
| Hawaii | 88 | 88 | (100.0) | (28.4) | (3.4) | (0.0) | (0.0) | (18.2) | (9.1) | (40.9) |
| Idaho | 7 | 5 | (71.4) | (20.0) | (0.0) | (0.0) | (0.0) | (20.0) | (20.0) | (40.0) |
| Illinois | 207 | 207 | (100.0) | (7.2) | (3.9) | (0.0) | (0.5) | (27.5) | (14.0) | (46.9) |
| Indiana | 83 | 83 | (100.0) | (16.9) | (8.4) | (0.0) | (1.2) | (14.5) | (18.1) | (41.0) |
| Iowa | 34 | 34 | (100.0) | (8.8) | (2.9) | (0.0) | (0.0) | (8.8) | (14.7) | (64.7) |
| Kansas | 35 | 31 | (88.6) | (19.4) | (0.0) | (0.0) | (3.2) | (19.4) | (32.3) | (25.8) |
| Kentucky | 59 | 59 | (100.0) | (10.2) | (0.0) | (0.0) | (0.0) | (13.6) | (28.8) | (47.5) |
| Louisiana | 88 | 80 | (90.9) | (11.3) | (2.5) | (0.0) | (3.8) | (7.5) | (28.8) | (46.3) |
| Maine | 17 | 14 | (82.4) | (14.3) | (21.4) | (0.0) | (0.0) | (21.4) | (28.6) | (14.3) |
| Maryland | 138 | 125 | (90.6) | (10.4) | (7.2) | (0.0) | (0.0) | (8.0) | (20.8) | (53.6) |
| Massachusetts | 139 | 137 | (98.6) | (29.9) | (0.7) | (0.0) | (0.0) | (23.4) | (5.1) | (40.9) |
| Michigan | 91 | 0 | (0.0) | … | … | … | … | … | … | … |
| Minnesota | 112 | 112 | (100.0) | (7.1) | (5.4) | (0.0) | (0.0) | (8.9) | (38.4) | (40.2) |
| Mississippi | 39 | 39 | (100.0) | (48.7) | (7.7) | (0.0) | (0.0) | (12.8) | (2.6) | (28.2) |
| Missouri | 70 | 25 | (35.7) | (24.0) | (16.0) | (0.0) | (0.0) | (20.0) | (0.0) | (40.0) |
| Montana | 4 | 4 | (100.0) | (25.0) | (50.0) | (0.0) | (0.0) | (0.0) | (0.0) | (25.0) |
| Nebraska | 34 | 31 | (91.2) | (19.4) | (6.5) | (0.0) | (0.0) | (16.1) | (16.1) | (41.9) |
| Nevada | 54 | 54 | (100.0) | (7.4) | (1.9) | (0.0) | (0.0) | (31.5) | (24.1) | (35.2) |
| New Hampshire | 12 | 12 | (100.0) | (41.7) | (0.0) | (0.0) | (8.3) | (0.0) | (0.0) | (50.0) |
| New Jersey | 234 | 231 | (98.7) | (19.0) | (3.9) | (0.0) | (0.4) | (18.6) | (15.2) | (42.9) |
| New Mexico | 28 | 27 | (96.4) | (18.5) | (0.0) | (0.0) | (0.0) | (33.3) | (18.5) | (29.6) |
| New York State2 | 157 | 142 | (90.4) | (23.2) | (9.9) | (0.0) | (0.0) | (25.4) | (3.5) | (38.0) |
| New York City | 438 | 422 | (96.3) | (28.0) | (4.5) | (0.0) | (0.7) | (20.1) | (4.5) | (42.2) |
| North Carolina | 150 | 150 | (100.0) | (27.3) | (2.7) | (0.0) | (2.0) | (18.0) | (11.3) | (38.7) |
| North Dakota | 10 | 9 | (90.0) | (22.2) | (33.3) | (0.0) | (0.0) | (0.0) | (0.0) | (44.4) |
| Ohio | 125 | 120 | (96.0) | (25.0) | (5.8) | (0.0) | (0.0) | (10.8) | (20.0) | (38.3) |
| Oklahoma | 61 | 58 | (95.1) | (41.4) | (3.4) | (0.0) | (0.0) | (19.0) | (6.9) | (29.3) |
| Oregon | 62 | 0 | (0.0) | … | … | … | … | … | … | … |
| Pennsylvania | 154 | 131 | (85.1) | (27.5) | (3.8) | (0.0) | (0.0) | (15.3) | (15.3) | (38.2) |
| Rhode Island | 8 | 8 | (100.0) | (12.5) | (12.5) | (0.0) | (0.0) | (37.5) | (0.0) | (37.5) |
| South Carolina | 64 | 62 | (96.9) | (27.4) | (6.5) | (0.0) | (0.0) | (22.6) | (8.1) | (35.5) |
| South Dakota | 16 | 16 | (100.0) | (6.3) | (0.0) | (0.0) | (0.0) | (0.0) | (62.5) | (31.3) |
| Tennessee | 109 | 109 | (100.0) | (11.9) | (2.8) | (0.0) | (0.9) | (10.1) | (28.4) | (45.9) |
| Texas | 836 | 694 | (83.0) | (26.9) | (2.6) | (0.0) | (0.4) | (14.3) | (16.4) | (39.3) |
| Utah | 27 | 27 | (100.0) | (40.7) | (7.4) | (0.0) | (0.0) | (7.4) | (14.8) | (29.6) |
| Vermont | 3 | 3 | (100.0) | (0.0) | (0.0) | (0.0) | (0.0) | (0.0) | (66.7) | (33.3) |
| Virginia | 163 | 158 | (96.9) | (7.0) | (1.9) | (0.0) | (0.6) | (13.9) | (27.8) | (48.7) |
| Washington | 154 | 145 | (94.2) | (16.6) | (3.4) | (0.7) | (0.7) | (7.6) | (24.1) | (46.9) |
| West Virginia | 13 | 13 | (100.0) | (30.8) | (7.7) | (0.0) | (0.0) | (15.4) | (7.7) | (38.5) |
| Wisconsin | 34 | 33 | (97.1) | (0.0) | (6.1) | (0.0) | (0.0) | (12.1) | (27.3) | (54.5) |
| Wyoming | 0 | 0 | … | … | … | … | … | … | … | … |
| American Samoa3 | 3 | 3 | (100.0) | (33.3) | (0.0) | (0.0) | (0.0) | (33.3) | (0.0) | (33.3) |
| Fed. States of Micronesia3 | 74 | 74 | (100.0) | (62.2) | (0.0) | (0.0) | (0.0) | (1.4) | (20.3) | (16.2) |
| Guam3 | 57 | 56 | (98.2) | (19.6) | (1.8) | (0.0) | (0.0) | (7.1) | (26.8) | (44.6) |
| Marshall Islands3 | 94 | 92 | (97.9) | (42.4) | (3.3) | (1.1) | (0.0) | (16.3) | (12.0) | (25.0) |
| Northern Mariana Islands3 | 38 | 23 | (60.5) | (47.8) | (0.0) | (0.0) | (0.0) | (4.3) | (0.0) | (47.8) |
| Puerto Rico3 | 26 | 26 | (100.0) | (19.2) | (0.0) | (0.0) | (0.0) | (26.9) | (38.5) | (15.4) |
| Palau3 | 9 | 9 | (100.0) | (22.2) | (0.0) | (0.0) | (0.0) | (0.0) | (11.1) | (66.7) |
| U.S. Virgin Islands3 | 3 | 1 | (33.3) | (100.0) | (0.0) | (0.0) | (0.0) | (0.0) | (0.0) | (0.0) |
1Occupation within past 12 months of TB diagnosis. Percentage based on 52 reporting areas (50 states, New York City, and the District of Columbia).
2Excludes New York City.
3Not included in U.S. totals.
Ellipses (…) indicate that the percentage cannot be calculated, and the denominator is 0.