Reported Tuberculosis in the United States, 2020
Table 37. Tuberculosis Cases and Percentages, by Residence in and Type of Correctional Facilities1, Ages ≥15 Years: Reporting Areas, 2020
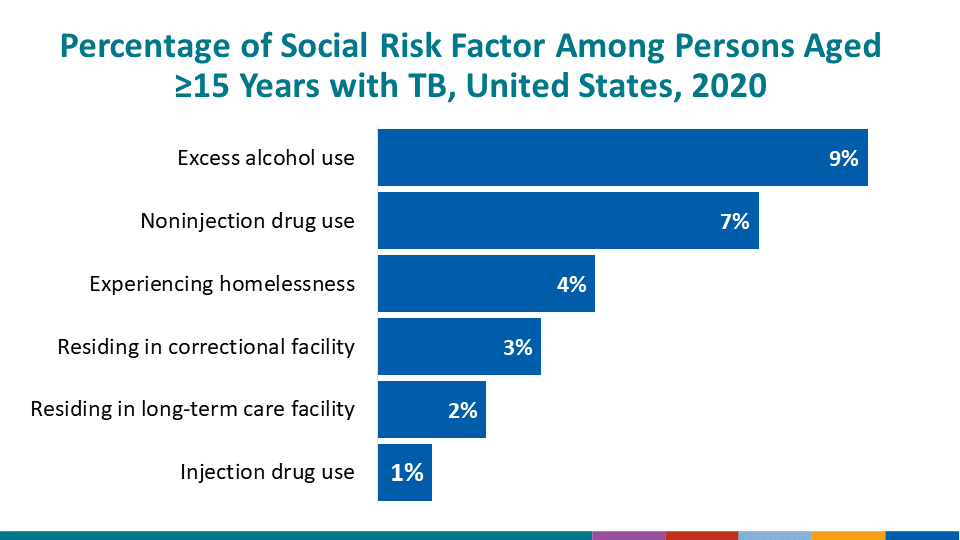
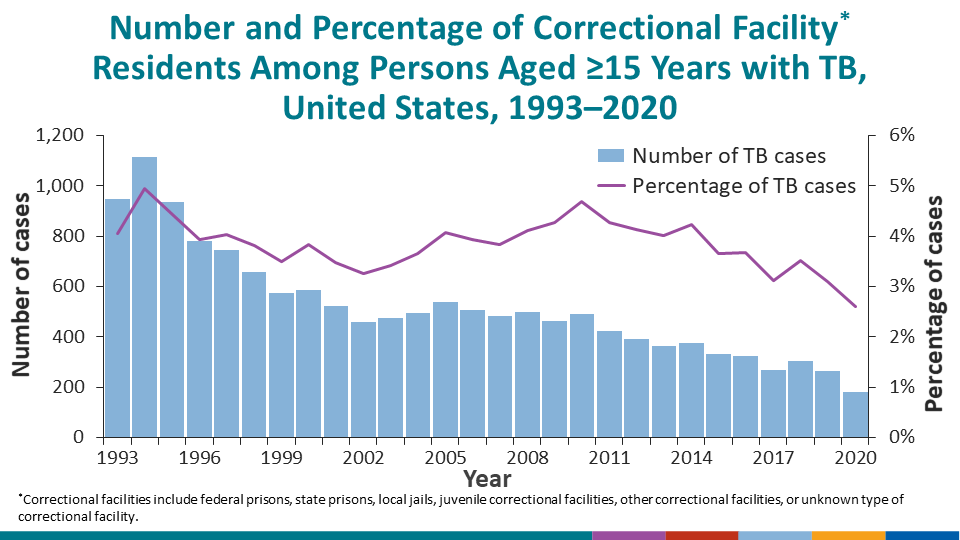
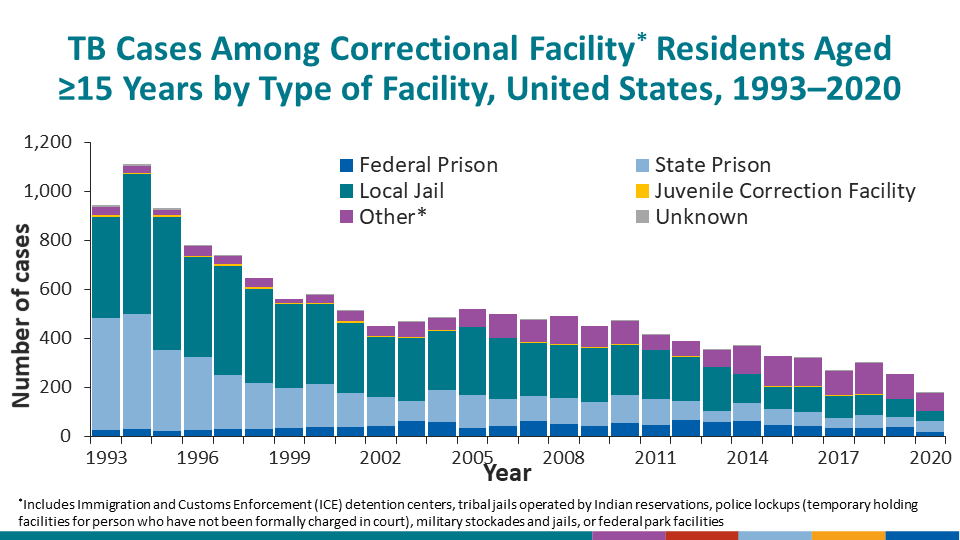
See Surveillance Slides #59, #60, #61, and #62.
| Reporting Area | Total Cases | Cases with Information on Residence in Correctional Facilities | Cases Reported as Residents of Correctional Facilities2 | Federal Prison | State Prison | Local Jail | Juvenile Facility3 | Other Type of Facility | Unknown/Missing | Cases with Information on ICE Custody4 | Cases Under ICE Custody | ||||||||||
|---|---|---|---|---|---|---|---|---|---|---|---|---|---|---|---|---|---|---|---|---|---|
| No. | (%) | No. | (%) | No. | (%) | No. | (%) | No. | (%) | No. | (%) | No. | (%) | No. | (%) | No. | (%) | No. | (%) | ||
| United States | 6,856 | 6,811 | (99.3) | 179 | (2.6) | 18 | (10.1) | 45 | (25.1) | 41 | (22.9) | 2 | (1.1) | 70 | (39.1) | 3 | (1.7) | 151 | (84.4) | 45 | (29.8) |
| Alabama | 69 | 69 | (100.0) | 3 | (4.3) | 0 | (0.0) | 3 | (100.0) | 0 | (0.0) | 0 | (0.0) | 0 | (0.0) | 0 | (0.0) | 3 | (100.0) | 0 | (0.0) |
| Alaska | 47 | 47 | (100.0) | 0 | (0.0) | 0 | … | 0 | … | 0 | … | 0 | … | 0 | … | 0 | … | 0 | … | 0 | … |
| Arizona | 128 | 127 | (99.2) | 22 | (17.3) | 0 | (0.0) | 0 | (0.0) | 1 | (4.5) | 0 | (0.0) | 21 | (95.5) | 0 | (0.0) | 0 | (0.0) | 0 | … |
| Arkansas | 53 | 53 | (100.0) | 2 | (3.8) | 0 | (0.0) | 2 | (100.0) | 0 | (0.0) | 0 | (0.0) | 0 | (0.0) | 0 | (0.0) | 2 | (100.0) | 0 | (0.0) |
| California | 1,658 | 1,654 | (99.8) | 35 | (2.1) | 6 | (17.1) | 1 | (2.9) | 15 | (42.9) | 0 | (0.0) | 13 | (37.1) | 0 | (0.0) | 35 | (100.0) | 10 | (28.6) |
| Colorado | 47 | 47 | (100.0) | 0 | (0.0) | 0 | … | 0 | … | 0 | … | 0 | … | 0 | … | 0 | … | 0 | … | 0 | … |
| Connecticut | 52 | 52 | (100.0) | 2 | (3.8) | 0 | (0.0) | 1 | (50.0) | 0 | (0.0) | 0 | (0.0) | 1 | (50.0) | 0 | (0.0) | 1 | (50.0) | 1 | (100.0) |
| Delaware | 16 | 16 | (100.0) | 0 | (0.0) | 0 | … | 0 | … | 0 | … | 0 | … | 0 | … | 0 | … | 0 | … | 0 | … |
| District of Columbia | 19 | 19 | (100.0) | 0 | (0.0) | 0 | … | 0 | … | 0 | … | 0 | … | 0 | … | 0 | … | 0 | … | 0 | … |
| Florida | 399 | 399 | (100.0) | 7 | (1.8) | 0 | (0.0) | 3 | (42.9) | 3 | (42.9) | 0 | (0.0) | 1 | (14.3) | 0 | (0.0) | 7 | (100.0) | 0 | (0.0) |
| Georgia | 211 | 207 | (98.1) | 6 | (2.9) | 0 | (0.0) | 2 | (33.3) | 3 | (50.0) | 0 | (0.0) | 1 | (16.7) | 0 | (0.0) | 6 | (100.0) | 0 | (0.0) |
| Hawaii | 88 | 88 | (100.0) | 0 | (0.0) | 0 | … | 0 | … | 0 | … | 0 | … | 0 | … | 0 | … | 0 | … | 0 | … |
| Idaho | 7 | 5 | (71.4) | 1 | (20.0) | 0 | (0.0) | 1 | (100.0) | 0 | (0.0) | 0 | (0.0) | 0 | (0.0) | 0 | (0.0) | 1 | (100.0) | 0 | (0.0) |
| Illinois | 207 | 207 | (100.0) | 1 | (0.5) | 0 | (0.0) | 0 | (0.0) | 1 | (100.0) | 0 | (0.0) | 0 | (0.0) | 0 | (0.0) | 1 | (100.0) | 0 | (0.0) |
| Indiana | 83 | 83 | (100.0) | 3 | (3.6) | 0 | (0.0) | 2 | (66.7) | 1 | (33.3) | 0 | (0.0) | 0 | (0.0) | 0 | (0.0) | 3 | (100.0) | 0 | (0.0) |
| Iowa | 34 | 34 | (100.0) | 0 | (0.0) | 0 | … | 0 | … | 0 | … | 0 | … | 0 | … | 0 | … | 0 | … | 0 | … |
| Kansas | 35 | 35 | (100.0) | 0 | (0.0) | 0 | … | 0 | … | 0 | … | 0 | … | 0 | … | 0 | … | 0 | … | 0 | … |
| Kentucky | 59 | 59 | (100.0) | 0 | (0.0) | 0 | … | 0 | … | 0 | … | 0 | … | 0 | … | 0 | … | 0 | … | 0 | … |
| Louisiana | 88 | 87 | (98.9) | 2 | (2.3) | 0 | (0.0) | 0 | (0.0) | 1 | (50.0) | 1 | (50.0) | 0 | (0.0) | 0 | (0.0) | 2 | (100.0) | 0 | (0.0) |
| Maine | 17 | 17 | (100.0) | 0 | (0.0) | 0 | … | 0 | … | 0 | … | 0 | … | 0 | … | 0 | … | 0 | … | 0 | … |
| Maryland | 138 | 135 | (97.8) | 0 | (0.0) | 0 | … | 0 | … | 0 | … | 0 | … | 0 | … | 0 | … | 0 | … | 0 | … |
| Massachusetts | 139 | 139 | (100.0) | 1 | (0.7) | 0 | (0.0) | 0 | (0.0) | 0 | (0.0) | 0 | 0.0 | 1 | (100.0) | 0 | (0.0) | 1 | (100.0) | 1 | (100.0) |
| Michigan | 91 | 90 | (98.9) | 1 | (1.1) | 0 | (0.0) | 1 | (100.0) | 0 | (0.0) | 0 | (0.0) | 0 | (0.0) | 0 | (0.0) | 0 | (0.0) | 0 | … |
| Minnesota | 112 | 111 | (99.1) | 0 | (0.0) | 0 | … | 0 | … | 0 | … | 0 | … | 0 | … | 0 | … | 0 | … | 0 | … |
| Mississippi | 39 | 39 | (100.0) | 1 | (2.6) | 1 | (100.0) | 0 | (0.0) | 0 | (0.0) | 0 | (0.0) | 0 | (0.0) | 0 | (0.0) | 1 | (100.0) | 1 | (100.0) |
| Missouri | 70 | 70 | (100.0) | 2 | (2.9) | 0 | (0.0) | 2 | (100.0) | 0 | (0.0) | 0 | (0.0) | 0 | (0.0) | 0 | (0.0) | 2 | (100.0) | 0 | (0.0) |
| Montana | 4 | 4 | (100.0) | 0 | (0.0) | 0 | … | 0 | … | 0 | … | 0 | … | 0 | … | 0 | … | 0 | … | 0 | … |
| Nebraska | 34 | 34 | (100.0) | 0 | (0.0) | 0 | … | 0 | … | 0 | … | 0 | … | 0 | … | 0 | … | 0 | … | 0 | … |
| Nevada | 54 | 54 | (100.0) | 0 | (0.0) | 0 | … | 0 | … | 0 | … | 0 | … | 0 | … | 0 | … | 0 | … | 0 | … |
| New Hampshire | 12 | 12 | (100.0) | 1 | (8.3) | 1 | (100.0) | 0 | (0.0) | 0 | (0.0) | 0 | (0.0) | 0 | (0.0) | 0 | (0.0) | 1 | (100.0) | 0 | (0.0) |
| New Jersey | 234 | 234 | (100.0) | 0 | (0.0) | 0 | … | 0 | … | 0 | … | 0 | … | 0 | … | 0 | … | 0 | … | 0 | … |
| New Mexico | 28 | 28 | (100.0) | 3 | (10.7) | 0 | (0.0) | 0 | (0.0) | 0 | (0.0) | 0 | (0.0) | 3 | (100.0) | 0 | (0.0) | 3 | (100.0) | 2 | (66.7) |
| New York State5 | 157 | 156 | (99.4) | 0 | (0.0) | 0 | … | 0 | … | 0 | … | 0 | … | 0 | … | 0 | … | 0 | … | 0 | … |
| New York City | 438 | 430 | (98.2) | 1 | (0.2) | 0 | (0.0) | 0 | (0.0) | 1 | (100.0) | 0 | (0.0) | 0 | (0.0) | 0 | (0.0) | 0 | (0.0) | 0 | … |
| North Carolina | 150 | 150 | (100.0) | 1 | (0.7) | 0 | (0.0) | 0 | (0.0) | 0 | (0.0) | 1 | (100.0) | 0 | (0.0) | 0 | (0.0) | 1 | (100.0) | 0 | (0.0) |
| North Dakota | 10 | 10 | (100.0) | 0 | (0.0) | 0 | … | 0 | … | 0 | … | 0 | … | 0 | … | 0 | … | 0 | … | 0 | … |
| Ohio | 125 | 121 | (96.8) | 0 | (0.0) | 0 | … | 0 | … | 0 | … | 0 | … | 0 | … | 0 | … | 0 | … | 0 | … |
| Oklahoma | 61 | 61 | (100.0) | 1 | (1.6) | 1 | (100.0) | 0 | (0.0) | 0 | (0.0) | 0 | (0.0) | 0 | (0.0) | 0 | (0.0) | 1 | (100.0) | 0 | (0.0) |
| Oregon | 62 | 62 | (100.0) | 1 | (1.6) | 0 | (0.0) | 1 | (100.0) | 0 | (0.0) | 0 | (0.0) | 0 | (0.0) | 0 | (0.0) | 0 | (0.0) | 0 | … |
| Pennsylvania | 154 | 153 | (99.4) | 3 | (2.0) | 1 | (33.3) | 0 | (0.0) | 1 | (33.3) | 0 | (0.0) | 0 | (0.0) | 1 | (33.3) | 3 | (100.0) | 2 | (66.7) |
| Rhode Island | 8 | 8 | (100.0) | 0 | (0.0) | 0 | … | 0 | … | 0 | … | 0 | … | 0 | … | 0 | … | 0 | … | 0 | … |
| South Carolina | 64 | 64 | (100.0) | 0 | (0.0) | 0 | … | 0 | … | 0 | … | 0 | … | 0 | … | 0 | … | 0 | … | 0 | … |
| South Dakota | 16 | 16 | (100.0) | 0 | (0.0) | 0 | … | 0 | … | 0 | … | 0 | … | 0 | … | 0 | … | 0 | … | 0 | … |
| Tennessee | 109 | 109 | (100.0) | 3 | (2.8) | 0 | (0.0) | 0 | (0.0) | 3 | (100.0) | 0 | (0.0) | 0 | (0.0) | 0 | (0.0) | 3 | (100.0) | 0 | (0.0) |
| Texas | 836 | 823 | (98.4) | 69 | (8.4) | 7 | (10.1) | 26 | (37.7) | 7 | (10.1) | 0 | (0.0) | 27 | (39.1) | 2 | (2.9) | 67 | (97.1) | 25 | (37.3) |
| Utah | 27 | 27 | (100.0) | 1 | (3.7) | 0 | (0.0) | 0 | (0.0) | 1 | (100.0) | 0 | (0.0) | 0 | (0.0) | 0 | (0.0) | 1 | (100.0) | 0 | (0.0) |
| Vermont | 3 | 3 | (100.0) | 0 | (0.0) | 0 | … | 0 | … | 0 | … | 0 | … | 0 | … | 0 | … | 0 | … | 0 | … |
| Virginia | 163 | 163 | (100.0) | 3 | (1.8) | 0 | (0.0) | 0 | (0.0) | 1 | (33.3) | 0 | (0.0) | 2 | (66.7) | 0 | (0.0) | 3 | (100.0) | 2 | (66.7) |
| Washington | 154 | 153 | (99.4) | 1 | (0.7) | 1 | (100.0) | 0 | (0.0) | 0 | (0.0) | 0 | (0.0) | 0 | (0.0) | 0 | (0.0) | 1 | (100.0) | 0 | (0.0) |
| West Virginia | 13 | 13 | (100.0) | 0 | (0.0) | 0 | … | 0 | … | 0 | … | 0 | … | 0 | … | 0 | … | 0 | … | 0 | … |
| Wisconsin | 34 | 34 | (100.0) | 2 | (5.9) | 0 | (0.0) | 0 | (0.0) | 2 | (100.0) | 0 | (0.0) | 0 | (0.0) | 0 | (0.0) | 2 | (100.0) | 1 | (50.0) |
| Wyoming | 0 | 0 | … | 0 | … | 0 | … | 0 | … | 0 | … | 0 | … | 0 | … | 0 | … | 0 | … | 0 | … |
| American Samoa6 | 3 | 3 | (100.0) | 0 | (0.0) | 0 | … | 0 | … | 0 | … | 0 | … | 0 | … | 0 | … | 0 | … | 0 | … |
| Fed. States of Micronesia6 | 74 | 73 | (98.6) | 1 | (1.4) | 0 | (0.0) | 1 | (100.0) | 0 | (0.0) | 0 | (0.0) | 0 | (0.0) | 0 | (0.0) | 1 | (100.0) | 0 | (0.0) |
| Guam6 | 57 | 57 | (100.0) | 3 | (5.3) | 0 | (0.0) | 0 | (0.0) | 3 | (100.0) | 0 | (0.0) | 0 | (0.0) | 0 | (0.0) | 3 | (100.0) | 0 | (0.0) |
| Marshall Islands6 | 94 | 92 | (97.9) | 0 | (0.0) | 0 | … | 0 | … | 0 | … | 0 | … | 0 | … | 0 | … | 0 | … | 0 | … |
| Northern Mariana Islands6 | 38 | 38 | (100.0) | 1 | (2.6) | 0 | (0.0) | 0 | (0.0) | 1 | (100.0) | 0 | (0.0) | 0 | (0.0) | 0 | (0.0) | 1 | (100.0) | 0 | (0.0) |
| Puerto Rico6 | 26 | 26 | (100.0) | 3 | (11.5) | 2 | (66.7) | 1 | (33.3) | 0 | (0.0) | 0 | (0.0) | 0 | (0.0) | 0 | (0.0) | 3 | (100.0) | 2 | (66.7) |
| Palau6 | 9 | 9 | (100.0) | 0 | (0.0) | 0 | … | 0 | … | 0 | … | 0 | … | 0 | … | 0 | … | 0 | … | 0 | … |
| U.S. Virgin Islands6 | 3 | 1 | (33.3) | 0 | (0.0) | 0 | … | 0 | … | 0 | … | 0 | … | 0 | … | 0 | … | 0 | … | 0 | … |
1Resident of correctional facility at time of TB diagnosis. Percentage based on 52 reporting areas (50 states, New York City, and the District of Columbia).
2Percent of those with known status.
3Excludes youth who are <15 years of age.
4Immigration and Customs Enforcement (ICE) detainment among cases who were residents in correctional facilities.
5Excludes New York City.
6Not included in U.S. totals.
Note: Ellipses (…) indicate that the percentage cannot be calculated, and the denominator is 0.