Reported Tuberculosis in the United States, 2020
Table 35. Tuberculosis Risk Factors1: Reporting Areas, 2020
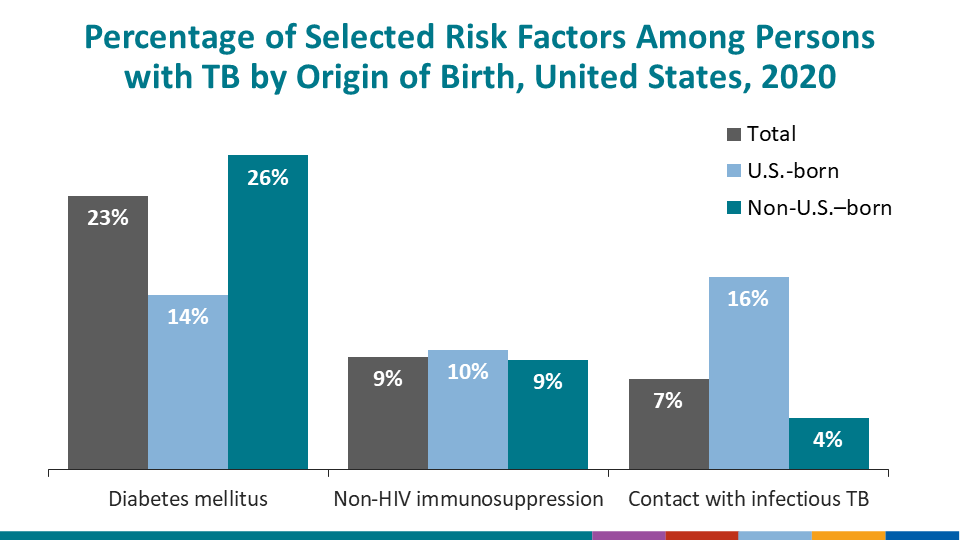
See Surveillance Slide #58.
| Reporting area | Total cases | Contact2 | Non-HIV immunosuppression3 | Diabetes mellitus | Post-organ transplantation | TNF-α inhibitors | Other4 | None | Unknown/missing | ||||||||
|---|---|---|---|---|---|---|---|---|---|---|---|---|---|---|---|---|---|
| No. | (%) | No. | (%) | No. | (%) | No. | (%) | No. | (%) | No. | (%) | No. | (%) | No. | (%) | ||
| United States | 7,174 | 532 | (7.4) | 662 | (9.2) | 1,615 | (22.5) | 65 | (0.9) | 51 | (0.7) | 1,735 | (24.2) | 3,185 | (44.4) | 325 | (4.5) |
| Alabama | 73 | 8 | (11.0) | 7 | (9.6) | 10 | (13.7) | 0 | (0.0) | 0 | (0.0) | 12 | (16.4) | 38 | (52.1) | 0 | (0.0) |
| Alaska | 58 | 22 | (37.9) | 2 | (3.4) | 7 | (12.1) | 0 | (0.0) | 0 | (0.0) | 11 | (19.0) | 19 | (32.8) | 0 | (0.0) |
| Arizona | 136 | 0 | (0.0) | 18 | (13.2) | 48 | (35.3) | 2 | (1.5) | 4 | (2.9) | 47 | (34.6) | 0 | (0.0) | 59 | (43.4) |
| Arkansas | 59 | 13 | (22.0) | 6 | (10.2) | 16 | (27.1) | 0 | (0.0) | 0 | (0.0) | 15 | (25.4) | 16 | (27.1) | 4 | (6.8) |
| California | 1,705 | 59 | (3.5) | 208 | (12.2) | 502 | (29.4) | 22 | (1.3) | 11 | (0.6) | 481 | (28.2) | 650 | (38.1) | 42 | (2.5) |
| Colorado | 52 | 6 | (11.5) | 3 | (5.8) | 9 | (17.3) | 0 | (0.0) | 0 | (0.0) | 11 | (21.2) | 29 | (55.8) | 0 | (0.0) |
| Connecticut | 54 | 1 | (1.9) | 6 | (11.1) | 10 | (18.5) | 0 | (0.0) | 3 | (5.6) | 13 | (24.1) | 36 | (66.7) | 0 | (0.0) |
| Delaware | 17 | 2 | (11.8) | 1 | (5.9) | 3 | (17.6) | 0 | (0.0) | 0 | (0.0) | 2 | (11.8) | 9 | (52.9) | 1 | (5.9) |
| District of Columbia | 19 | 2 | (10.5) | 2 | (10.5) | 1 | (5.3) | 1 | (5.3) | 0 | (0.0) | 1 | (5.3) | 14 | (73.7) | 0 | (0.0) |
| Florida | 412 | 31 | (7.5) | 49 | (11.9) | 73 | (17.7) | 2 | (0.5) | 0 | (0.0) | 96 | (23.3) | 161 | (39.1) | 26 | (6.3) |
| Georgia | 221 | 28 | (12.7) | 9 | (4.1) | 41 | (18.6) | 0 | (0.0) | 1 | (0.5) | 53 | (24.0) | 120 | (54.3) | 5 | (2.3) |
| Hawaii | 92 | 10 | (10.9) | 10 | (10.9) | 37 | (40.2) | 0 | (0.0) | 0 | (0.0) | 16 | (17.4) | 32 | (34.8) | 0 | (0.0) |
| Idaho | 8 | 0 | (0.0) | 1 | (12.5) | 0 | (0.0) | 0 | (0.0) | 1 | (12.5) | 0 | (0.0) | 3 | (37.5) | 3 | (37.5) |
| Illinois | 216 | 23 | (10.6) | 25 | (11.6) | 38 | (17.6) | 2 | (0.9) | 0 | (0.0) | 54 | (25.0) | 95 | (44.0) | 0 | (0.0) |
| Indiana | 92 | 14 | (15.2) | 9 | (9.8) | 16 | (17.4) | 1 | (1.1) | 2 | (2.2) | 27 | (29.3) | 33 | (35.9) | 0 | (0.0) |
| Iowa | 39 | 4 | (10.3) | 0 | (0.0) | 6 | (15.4) | 0 | (0.0) | 0 | (0.0) | 8 | (20.5) | 23 | (59.0) | 0 | (0.0) |
| Kansas | 37 | 2 | (5.4) | 3 | (8.1) | 5 | (13.5) | 0 | (0.0) | 0 | (0.0) | 4 | (10.8) | 23 | (62.2) | 0 | (0.0) |
| Kentucky | 67 | 15 | (22.4) | 4 | (6.0) | 9 | (13.4) | 1 | (1.5) | 0 | (0.0) | 34 | (50.7) | 20 | (29.9) | 0 | (0.0) |
| Louisiana | 99 | 16 | (16.2) | 8 | (8.1) | 10 | (10.1) | 0 | (0.0) | 0 | (0.0) | 11 | (11.1) | 53 | (53.5) | 7 | (7.1) |
| Maine | 17 | 2 | (11.8) | 2 | (11.8) | 3 | (17.6) | 0 | (0.0) | 0 | (0.0) | 2 | (11.8) | 7 | (41.2) | 2 | (11.8) |
| Maryland | 149 | 6 | (4.0) | 11 | (7.4) | 20 | (13.4) | 1 | (0.7) | 1 | (0.7) | 30 | (20.1) | 66 | (44.3) | 24 | (16.1) |
| Massachusetts | 142 | 5 | (3.5) | 21 | (14.8) | 24 | (16.9) | 1 | (0.7) | 2 | (1.4) | 50 | (35.2) | 90 | (63.4) | 0 | (0.0) |
| Michigan | 101 | 0 | (0.0) | 19 | (18.8) | 24 | (23.8) | 0 | (0.0) | 1 | (1.0) | 32 | (31.7) | 0 | (0.0) | 47 | (46.5) |
| Minnesota | 117 | 8 | (6.8) | 14 | (12.0) | 27 | (23.1) | 1 | (0.9) | 1 | (0.9) | 83 | (70.9) | 21 | (17.9) | 0 | (0.0) |
| Mississippi | 41 | 5 | (12.2) | 4 | (9.8) | 5 | (12.2) | 0 | (0.0) | 0 | (0.0) | 34 | (82.9) | 6 | (14.6) | 0 | (0.0) |
| Missouri | 72 | 8 | (11.1) | 10 | (13.9) | 9 | (12.5) | 0 | (0.0) | 1 | (1.4) | 6 | (8.3) | 20 | (27.8) | 23 | (31.9) |
| Montana | 4 | 0 | (0.0) | 1 | (25.0) | 0 | (0.0) | 0 | (0.0) | 0 | (0.0) | 0 | (0.0) | 3 | (75.0) | 0 | (0.0) |
| Nebraska | 36 | 7 | (19.4) | 1 | (2.8) | 1 | (2.8) | 0 | (0.0) | 0 | (0.0) | 4 | (11.1) | 15 | (41.7) | 8 | (22.2) |
| Nevada | 57 | 1 | (1.8) | 5 | (8.8) | 14 | (24.6) | 0 | (0.0) | 1 | (1.8) | 11 | (19.3) | 33 | (57.9) | 0 | (0.0) |
| New Hampshire | 12 | 1 | (8.3) | 1 | (8.3) | 0 | (0.0) | 0 | (0.0) | 0 | (0.0) | 0 | (0.0) | 10 | (83.3) | 0 | (0.0) |
| New Jersey | 245 | 11 | (4.5) | 24 | (9.8) | 57 | (23.3) | 2 | (0.8) | 1 | (0.4) | 41 | (16.7) | 132 | (53.9) | 1 | (0.4) |
| New Mexico | 29 | 5 | (17.2) | 2 | (6.9) | 9 | (31.0) | 0 | (0.0) | 0 | (0.0) | 7 | (24.1) | 11 | (37.9) | 0 | (0.0) |
| New York State5 | 161 | 14 | (8.7) | 21 | (13.0) | 25 | (15.5) | 0 | (0.0) | 2 | (1.2) | 31 | (19.3) | 76 | (47.2) | 2 | (1.2) |
| New York City | 445 | 11 | (2.5) | 33 | (7.4) | 105 | (23.6) | 2 | (0.4) | 3 | (0.7) | 61 | (13.7) | 261 | (58.7) | 11 | (2.5) |
| North Carolina | 159 | 16 | (10.1) | 17 | (10.7) | 32 | (20.1) | 6 | (3.8) | 0 | (0.0) | 74 | (46.5) | 76 | (47.8) | 0 | (0.0) |
| North Dakota | 10 | 1 | (10.0) | 1 | (10.0) | 2 | (20.0) | 1 | (10.0) | 0 | (0.0) | 1 | (10.0) | 6 | (60.0) | 0 | (0.0) |
| Ohio | 130 | 10 | (7.7) | 4 | (3.1) | 16 | (12.3) | 2 | (1.5) | 2 | (1.5) | 22 | (16.9) | 72 | (55.4) | 4 | (3.1) |
| Oklahoma | 67 | 16 | (23.9) | 7 | (10.4) | 19 | (28.4) | 1 | (1.5) | 0 | (0.0) | 21 | (31.3) | 23 | (34.3) | 0 | (0.0) |
| Oregon | 67 | 0 | (0.0) | 5 | (7.5) | 14 | (20.9) | 0 | (0.0) | 1 | (1.5) | 0 | (0.0) | 0 | (0.0) | 50 | (74.6) |
| Pennsylvania | 157 | 5 | (3.2) | 6 | (3.8) | 23 | (14.6) | 2 | (1.3) | 0 | (0.0) | 19 | (12.1) | 105 | (66.9) | 0 | (0.0) |
| Rhode Island | 8 | 0 | (0.0) | 0 | (0.0) | 2 | (25.0) | 0 | (0.0) | 0 | (0.0) | 4 | (50.0) | 3 | (37.5) | 0 | (0.0) |
| South Carolina | 67 | 4 | (6.0) | 5 | (7.5) | 13 | (19.4) | 0 | (0.0) | 1 | (1.5) | 7 | (10.4) | 39 | (58.2) | 1 | (1.5) |
| South Dakota | 16 | 0 | (0.0) | 4 | (25.0) | 5 | (31.3) | 0 | (0.0) | 0 | (0.0) | 7 | (43.8) | 5 | (31.3) | 0 | (0.0) |
| Tennessee | 113 | 15 | (13.3) | 11 | (9.7) | 21 | (18.6) | 0 | (0.0) | 0 | (0.0) | 20 | (17.7) | 58 | (51.3) | 0 | (0.0) |
| Texas | 884 | 89 | (10.1) | 35 | (4.0) | 210 | (23.8) | 13 | (1.5) | 5 | (0.6) | 193 | (21.8) | 462 | (52.3) | 3 | (0.3) |
| Utah | 29 | 2 | (6.9) | 2 | (6.9) | 7 | (24.1) | 0 | (0.0) | 1 | (3.4) | 11 | (37.9) | 12 | (41.4) | 0 | (0.0) |
| Vermont | 3 | 0 | (0.0) | 0 | (0.0) | 1 | (33.3) | 0 | (0.0) | 0 | (0.0) | 0 | (0.0) | 0 | (0.0) | 2 | (66.7) |
| Virginia | 169 | 14 | (8.3) | 11 | (6.5) | 33 | (19.5) | 1 | (0.6) | 4 | (2.4) | 33 | (19.5) | 85 | (50.3) | 0 | (0.0) |
| Washington | 163 | 15 | (9.2) | 13 | (8.0) | 44 | (27.0) | 1 | (0.6) | 2 | (1.2) | 17 | (10.4) | 93 | (57.1) | 0 | (0.0) |
| West Virginia | 13 | 1 | (7.7) | 0 | (0.0) | 2 | (15.4) | 0 | (0.0) | 0 | (0.0) | 5 | (38.5) | 6 | (46.2) | 0 | (0.0) |
| Wisconsin | 35 | 4 | (11.4) | 1 | (2.9) | 7 | (20.0) | 0 | (0.0) | 0 | (0.0) | 13 | (37.1) | 15 | (42.9) | 0 | (0.0) |
| Wyoming | 0 | 0 | … | 0 | … | 0 | … | 0 | … | 0 | … | 0 | … | 0 | … | 0 | … |
| American Samoa6 | 3 | 0 | (0.0) | 0 | (0.0) | 2 | (66.7) | 0 | (0.0) | 0 | (0.0) | 1 | (33.3) | 1 | (33.3) | 0 | (0.0) |
| Fed. States of Micronesia6 | 84 | 29 | (34.5) | 0 | (0.0) | 12 | (14.3) | 0 | (0.0) | 0 | (0.0) | 29 | (34.5) | 19 | (22.6) | 0 | (0.0) |
| Guam6 | 57 | 7 | (12.3) | 6 | (10.5) | 24 | (42.1) | 1 | (1.8) | 0 | (0.0) | 6 | (10.5) | 21 | (36.8) | 1 | (1.8) |
| Marshall Islands6 | 149 | 74 | (49.7) | 0 | (0.0) | 36 | (24.2) | 0 | (0.0) | 0 | (0.0) | 3 | (2.0) | 40 | (26.8) | 1 | (0.7) |
| Northern Mariana Islands6 | 39 | 3 | (7.7) | 1 | (2.6) | 16 | (41.0) | 0 | (0.0) | 0 | (0.0) | 4 | (10.3) | 13 | (33.3) | 3 | (7.7) |
| Puerto Rico6 | 27 | 4 | (14.8) | 0 | (0.0) | 7 | (25.9) | 0 | (0.0) | 0 | (0.0) | 0 | (0.0) | 17 | (63.0) | 0 | (0.0) |
| Palau6 | 9 | 2 | (22.2) | 0 | (0.0) | 5 | (55.6) | 0 | (0.0) | 0 | (0.0) | 3 | (33.3) | 1 | (11.1) | 0 | (0.0) |
| U.S. Virgin Islands6 | 4 | 1 | (25.0) | 0 | (0.0) | 0 | (0.0) | 0 | (0.0) | 0 | (0.0) | 0 | (0.0) | 1 | (25.0) | 2 | (50.0) |
1Includes the number of risk factors reported (which may be more than one per case) and the number of cases with no information on additional risk factors. The sum of risk factors is greater than the total number of cases because more than one risk factor may be selected per case.
2Includes risk factor responses of MDR patient contact, missed contact, and infectious TB patient contact.
3Includes risk factor responses of end-stage renal disease and non-HIV immunosuppression.
4Includes risk factor responses of incomplete LTBI therapy and Other.
5Excludes New York City.
6Not included in U.S. totals.
Zero % (0.0) denotes <0.05%.
Ellipses (…) indicate that the percentage cannot be calculated, and the denominator is 0.