Reported Tuberculosis in the United States, 2020
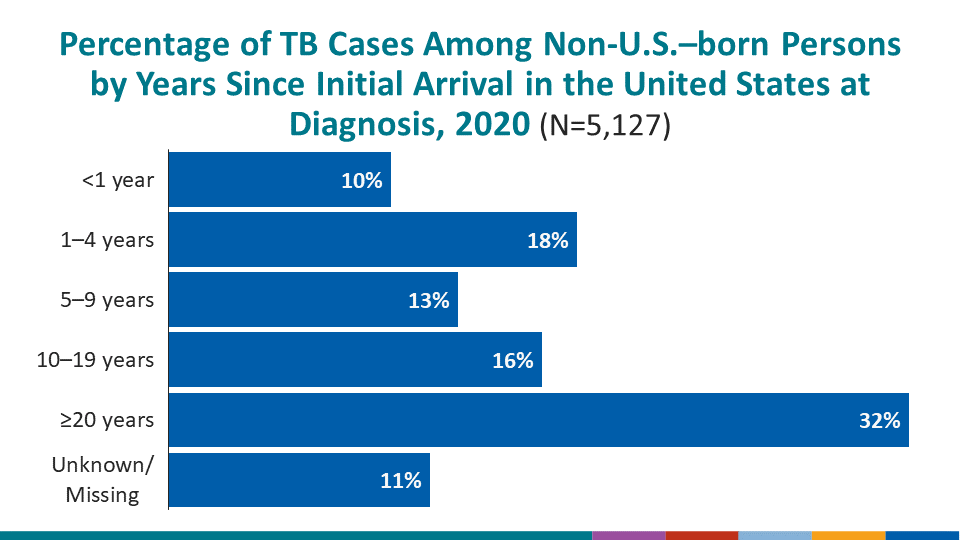
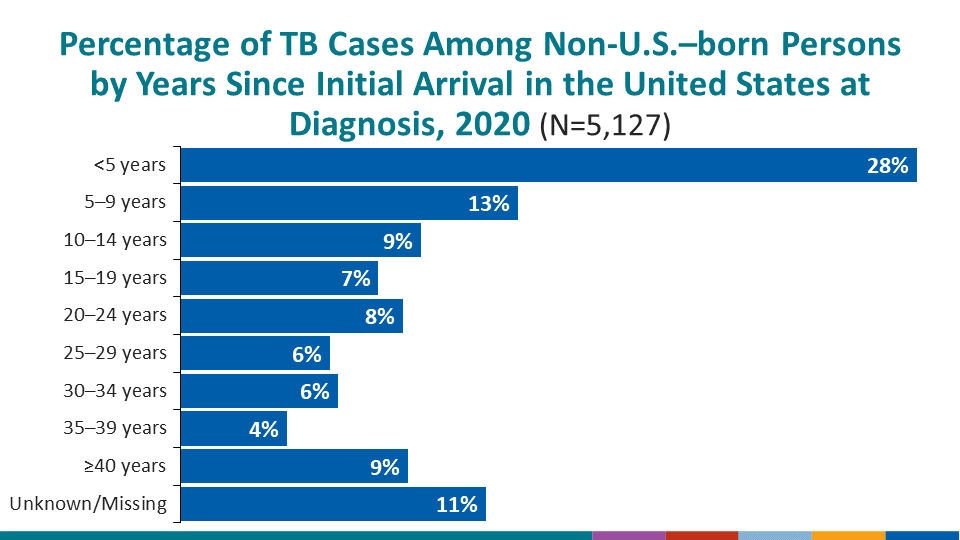
Table 33. Tuberculosis Cases and Percentages Among Non-U.S.–Born Persons,1 by Number of Years in the United States: United States and the District of Columbia, 2020
See Surveillance Slides #16 and #17.
| Reporting area | Total cases | <1 Year | 1–4 | 5–9 | 10–14 | 15–19 | 20–24 | 25–29 | 30–34 | 35–39 | ≥40 | Unknown/missing | |||||||||||
| No. | (%) | No. | (%) | No. | (%) | No. | (%) | No. | (%) | No. | (%) | No. | (%) | No. | (%) | No. | (%) | No. | (%) | No. | (%) | ||
| United States | 5,127 | 499 | (9.7) | 913 | (17.8) | 644 | (12.6) | 460 | (9.0) | 377 | (7.4) | 424 | (8.3) | 286 | (5.6) | 301 | (5.9) | 203 | (4.0) | 435 | (8.5) | 585 | (11.4) |
| Alabama | 25 | 4 | (16.0) | 10 | (40.0) | 1 | (4.0) | 2 | (8.0) | 3 | (12.0) | 1 | (4.0) | 3 | (12.0) | 1 | (4.0) | 0 | (0.0) | 0 | (0.0) | 0 | (0.0) |
| Alaska | 13 | 1 | (7.7) | 3 | (23.1) | 0 | (0.0) | 3 | (23.1) | 1 | (7.7) | 1 | (7.7) | 1 | (7.7) | 1 | (7.7) | 1 | (7.7) | 1 | (7.7) | 0 | (0.0) |
| Arizona | 92 | 17 | (18.5) | 10 | (10.9) | 6 | (6.5) | 6 | (6.5) | 6 | (6.5) | 12 | (13.0) | 5 | (5.4) | 7 | (7.6) | 7 | (7.6) | 16 | (17.4) | 0 | (0.0) |
| Arkansas | 21 | 2 | (9.5) | 6 | (28.6) | 3 | (14.3) | 2 | (9.5) | 3 | (14.3) | 3 | (14.3) | 0 | (0.0) | 1 | (4.8) | 0 | (0.0) | 1 | (4.8) | 0 | (0.0) |
| California | 1,419 | 103 | (7.3) | 143 | (10.1) | 118 | (8.3) | 103 | (7.3) | 87 | (6.1) | 120 | (8.5) | 88 | (6.2) | 112 | (7.9) | 66 | (4.7) | 175 | (12.3) | 304 | (21.4) |
| Colorado | 40 | 4 | (10.0) | 10 | (25.0) | 5 | (12.5) | 5 | (12.5) | 2 | (5.0) | 1 | (2.5) | 2 | (5.0) | 2 | (5.0) | 1 | (2.5) | 0 | (0.0) | 8 | (20.0) |
| Connecticut | 43 | 7 | (16.3) | 12 | (27.9) | 6 | (14.0) | 2 | (4.7) | 3 | (7.0) | 3 | (7.0) | 3 | (7.0) | 2 | (4.7) | 1 | (2.3) | 4 | (9.3) | 0 | (0.0) |
| Delaware | 9 | 0 | (0.0) | 1 | (11.1) | 3 | (33.3) | 1 | (11.1) | 1 | (11.1) | 1 | (11.1) | 0 | (0.0) | 1 | (11.1) | 0 | (0.0) | 0 | (0.0) | 1 | (11.1) |
| District of Columbia | 17 | 1 | (5.9) | 2 | (11.8) | 4 | (23.5) | 4 | (23.5) | 3 | (17.6) | 0 | (0.0) | 0 | (0.0) | 2 | (11.8) | 1 | (5.9) | 0 | (0.0) | 0 | (0.0) |
| Florida | 269 | 39 | (14.5) | 55 | (20.4) | 25 | (9.3) | 29 | (10.8) | 31 | (11.5) | 35 | (13.0) | 12 | (4.5) | 15 | (5.6) | 7 | (2.6) | 21 | (7.8) | 0 | (0.0) |
| Georgia | 122 | 9 | (7.4) | 25 | (20.5) | 20 | (16.4) | 17 | (13.9) | 14 | (11.5) | 7 | (5.7) | 7 | (5.7) | 4 | (3.3) | 3 | (2.5) | 4 | (3.3) | 12 | (9.8) |
| Hawaii | 75 | 7 | (9.3) | 8 | (10.7) | 8 | (10.7) | 4 | (5.3) | 11 | (14.7) | 8 | (10.7) | 5 | (6.7) | 3 | (4.0) | 4 | (5.3) | 8 | (10.7) | 9 | (12.0) |
| Idaho | 3 | 0 | (0.0) | 0 | (0.0) | 1 | (33.3) | 0 | (0.0) | 1 | (33.3) | 0 | (0.0) | 0 | (0.0) | 0 | (0.0) | 0 | (0.0) | 0 | (0.0) | 1 | (33.3) |
| Illinois | 164 | 15 | (9.1) | 21 | (12.8) | 27 | (16.5) | 15 | (9.1) | 13 | (7.9) | 14 | (8.5) | 12 | (7.3) | 13 | (7.9) | 5 | (3.0) | 26 | (15.9) | 3 | (1.8) |
| Indiana | 53 | 1 | (1.9) | 13 | (24.5) | 12 | (22.6) | 8 | (15.1) | 2 | (3.8) | 7 | (13.2) | 4 | (7.5) | 1 | (1.9) | 1 | (1.9) | 2 | (3.8) | 2 | (3.8) |
| Iowa | 25 | 7 | (28.0) | 8 | (32.0) | 2 | (8.0) | 2 | (8.0) | 2 | (8.0) | 1 | (4.0) | 0 | (0.0) | 1 | (4.0) | 0 | (0.0) | 0 | (0.0) | 2 | (8.0) |
| Kansas | 27 | 2 | (7.4) | 4 | (14.8) | 5 | (18.5) | 1 | (3.7) | 3 | (11.1) | 1 | (3.7) | 2 | (7.4) | 2 | (7.4) | 1 | (3.7) | 1 | (3.7) | 5 | (18.5) |
| Kentucky | 35 | 5 | (14.3) | 15 | (42.9) | 6 | (17.1) | 2 | (5.7) | 2 | (5.7) | 1 | (2.9) | 1 | (2.9) | 0 | (0.0) | 0 | (0.0) | 0 | (0.0) | 3 | (8.6) |
| Louisiana | 28 | 3 | (10.7) | 10 | (35.7) | 2 | (7.1) | 3 | (10.7) | 1 | (3.6) | 4 | (14.3) | 0 | (0.0) | 3 | (10.7) | 1 | (3.6) | 1 | (3.6) | 0 | (0.0) |
| Maine | 11 | 3 | (27.3) | 5 | (45.5) | 1 | (9.1) | 0 | (0.0) | 0 | (0.0) | 0 | (0.0) | 0 | (0.0) | 0 | (0.0) | 2 | (18.2) | 0 | (0.0) | 0 | (0.0) |
| Maryland | 120 | 16 | (13.3) | 38 | (31.7) | 20 | (16.7) | 11 | (9.2) | 5 | (4.2) | 7 | (5.8) | 11 | (9.2) | 7 | (5.8) | 2 | (1.7) | 3 | (2.5) | 0 | (0.0) |
| Massachusetts | 125 | 19 | (15.2) | 35 | (28.0) | 18 | (14.4) | 11 | (8.8) | 6 | (4.8) | 11 | (8.8) | 7 | (5.6) | 5 | (4.0) | 5 | (4.0) | 1 | (0.8) | 7 | (5.6) |
| Michigan | 52 | 3 | (5.8) | 9 | (17.3) | 12 | (23.1) | 5 | (9.6) | 2 | (3.8) | 2 | (3.8) | 3 | (5.8) | 7 | (13.5) | 2 | (3.8) | 6 | (11.5) | 1 | (1.9) |
| Minnesota | 105 | 6 | (5.7) | 29 | (27.6) | 26 | (24.8) | 14 | (13.3) | 15 | (14.3) | 3 | (2.9) | 4 | (3.8) | 2 | (1.9) | 3 | (2.9) | 2 | (1.9) | 1 | (1.0) |
| Mississippi | 11 | 1 | (9.1) | 1 | (9.1) | 3 | (27.3) | 0 | (0.0) | 2 | (18.2) | 0 | (0.0) | 0 | (0.0) | 2 | (18.2) | 0 | (0.0) | 2 | (18.2) | 0 | (0.0) |
| Missouri | 42 | 5 | (11.9) | 9 | (21.4) | 1 | (2.4) | 3 | (7.1) | 3 | (7.1) | 2 | (4.8) | 1 | (2.4) | 1 | (2.4) | 0 | (0.0) | 1 | (2.4) | 16 | (38.1) |
| Montana | 1 | 0 | (0.0) | 0 | (0.0) | 1 | (100.0) | 0 | (0.0) | 0 | (0.0) | 0 | (0.0) | 0 | (0.0) | 0 | (0.0) | 0 | (0.0) | 0 | (0.0) | 0 | (0.0) |
| Nebraska | 21 | 3 | (14.3) | 2 | (9.5) | 7 | (33.3) | 2 | (9.5) | 1 | (4.8) | 3 | (14.3) | 1 | (4.8) | 1 | (4.8) | 0 | (0.0) | 1 | (4.8) | 0 | (0.0) |
| Nevada | 41 | 4 | (9.8) | 8 | (19.5) | 2 | (4.9) | 5 | (12.2) | 0 | (0.0) | 5 | (12.2) | 4 | (9.8) | 3 | (7.3) | 5 | (12.2) | 5 | (12.2) | 0 | (0.0) |
| New Hampshire | 11 | 2 | (18.2) | 4 | (36.4) | 1 | (9.1) | 2 | (18.2) | 0 | (0.0) | 1 | (9.1) | 1 | (9.1) | 0 | (0.0) | 0 | (0.0) | 0 | (0.0) | 0 | (0.0) |
| New Jersey | 201 | 9 | (4.5) | 37 | (18.4) | 30 | (14.9) | 19 | (9.5) | 13 | (6.5) | 13 | (6.5) | 7 | (3.5) | 19 | (9.5) | 7 | (3.5) | 8 | (4.0) | 39 | (19.4) |
| New Mexico | 19 | 5 | (26.3) | 1 | (5.3) | 0 | (0.0) | 0 | (0.0) | 2 | (10.5) | 1 | (5.3) | 0 | (0.0) | 1 | (5.3) | 3 | (15.8) | 6 | (31.6) | 0 | (0.0) |
| New York State2 | 125 | 8 | (6.4) | 20 | (16.0) | 23 | (18.4) | 17 | (13.6) | 9 | (7.2) | 17 | (13.6) | 5 | (4.0) | 8 | (6.4) | 7 | (5.6) | 9 | (7.2) | 2 | (1.6) |
| New York City | 391 | 22 | (5.6) | 87 | (22.3) | 54 | (13.8) | 50 | (12.8) | 27 | (6.9) | 28 | (7.2) | 29 | (7.4) | 19 | (4.9) | 16 | (4.1) | 31 | (7.9) | 28 | (7.2) |
| North Carolina | 89 | 13 | (14.6) | 16 | (18.0) | 7 | (7.9) | 5 | (5.6) | 4 | (4.5) | 2 | (2.2) | 2 | (2.2) | 2 | (2.2) | 2 | (2.2) | 2 | (2.2) | 34 | (38.2) |
| North Dakota | 7 | 1 | (14.3) | 1 | (14.3) | 4 | (57.1) | 0 | (0.0) | 0 | (0.0) | 1 | (14.3) | 0 | (0.0) | 0 | (0.0) | 0 | (0.0) | 0 | (0.0) | 0 | (0.0) |
| Ohio | 88 | 15 | (17.0) | 21 | (23.9) | 16 | (18.2) | 8 | (9.1) | 6 | (6.8) | 4 | (4.5) | 5 | (5.7) | 2 | (2.3) | 2 | (2.3) | 7 | (8.0) | 2 | (2.3) |
| Oklahoma | 33 | 4 | (12.1) | 4 | (12.1) | 4 | (12.1) | 3 | (9.1) | 2 | (6.1) | 6 | (18.2) | 3 | (9.1) | 0 | (0.0) | 0 | (0.0) | 3 | (9.1) | 4 | (12.1) |
| Oregon | 52 | 1 | (1.9) | 8 | (15.4) | 5 | (9.6) | 5 | (9.6) | 0 | (0.0) | 1 | (1.9) | 2 | (3.8) | 0 | (0.0) | 0 | (0.0) | 1 | (1.9) | 29 | (55.8) |
| Pennsylvania | 118 | 8 | (6.8) | 26 | (22.0) | 24 | (20.3) | 13 | (11.0) | 11 | (9.3) | 16 | (13.6) | 5 | (4.2) | 4 | (3.4) | 5 | (4.2) | 5 | (4.2) | 1 | (0.8) |
| Rhode Island | 7 | 1 | (14.3) | 0 | (0.0) | 2 | (28.6) | 0 | (0.0) | 0 | (0.0) | 2 | (28.6) | 1 | (14.3) | 0 | (0.0) | 0 | (0.0) | 1 | (14.3) | 0 | (0.0) |
| South Carolina | 31 | 1 | (3.2) | 9 | (29.0) | 4 | (12.9) | 4 | (12.9) | 3 | (9.7) | 2 | (6.5) | 3 | (9.7) | 2 | (6.5) | 0 | (0.0) | 3 | (9.7) | 0 | (0.0) |
| South Dakota | 8 | 0 | (0.0) | 3 | (37.5) | 2 | (25.0) | 3 | (37.5) | 0 | (0.0) | 0 | (0.0) | 0 | (0.0) | 0 | (0.0) | 0 | (0.0) | 0 | (0.0) | 0 | (0.0) |
| Tennessee | 58 | 9 | (15.5) | 18 | (31.0) | 9 | (15.5) | 6 | (10.3) | 6 | (10.3) | 5 | (8.6) | 2 | (3.4) | 2 | (3.4) | 1 | (1.7) | 0 | (0.0) | 0 | (0.0) |
| Texas | 553 | 74 | (13.4) | 110 | (19.9) | 72 | (13.0) | 44 | (8.0) | 49 | (8.9) | 46 | (8.3) | 25 | (4.5) | 28 | (5.1) | 35 | (6.3) | 67 | (12.1) | 3 | (0.5) |
| Utah | 22 | 3 | (13.6) | 2 | (9.1) | 3 | (13.6) | 0 | (0.0) | 1 | (4.5) | 6 | (27.3) | 2 | (9.1) | 3 | (13.6) | 0 | (0.0) | 2 | (9.1) | 0 | (0.0) |
| Vermont | 2 | 0 | (0.0) | 0 | (0.0) | 0 | (0.0) | 2 | (100.0) | 0 | (0.0) | 0 | (0.0) | 0 | (0.0) | 0 | (0.0) | 0 | (0.0) | 0 | (0.0) | 0 | (0.0) |
| Virginia | 145 | 22 | (15.2) | 27 | (18.6) | 19 | (13.1) | 12 | (8.3) | 16 | (11.0) | 13 | (9.0) | 14 | (9.7) | 8 | (5.5) | 4 | (2.8) | 5 | (3.4) | 5 | (3.4) |
| Washington | 129 | 11 | (8.5) | 19 | (14.7) | 13 | (10.1) | 6 | (4.7) | 4 | (3.1) | 5 | (3.9) | 2 | (1.6) | 3 | (2.3) | 2 | (1.6) | 2 | (1.6) | 62 | (48.1) |
| West Virginia | 7 | 1 | (14.3) | 2 | (28.6) | 1 | (14.3) | 0 | (0.0) | 0 | (0.0) | 1 | (14.3) | 1 | (14.3) | 0 | (0.0) | 0 | (0.0) | 1 | (14.3) | 0 | (0.0) |
| Wisconsin | 22 | 2 | (9.1) | 6 | (27.3) | 6 | (27.3) | 1 | (4.5) | 1 | (4.5) | 1 | (4.5) | 1 | (4.5) | 1 | (4.5) | 1 | (4.5) | 1 | (4.5) | 1 | (4.5) |
| Wyoming | 0 | 0 | … | 0 | … | 0 | … | 0 | … | 0 | … | 0 | … | 0 | … | 0 | … | 0 | … | 0 | … | 0 | … |
1Includes persons born outside the United States or the U.S. territories, except persons born to at least one U.S. citizen parent.
2Excludes New York City.
Ellipses (…) indicate that the percentage cannot be calculated, and the denominator is 0.