Reported Tuberculosis in the United States, 2020
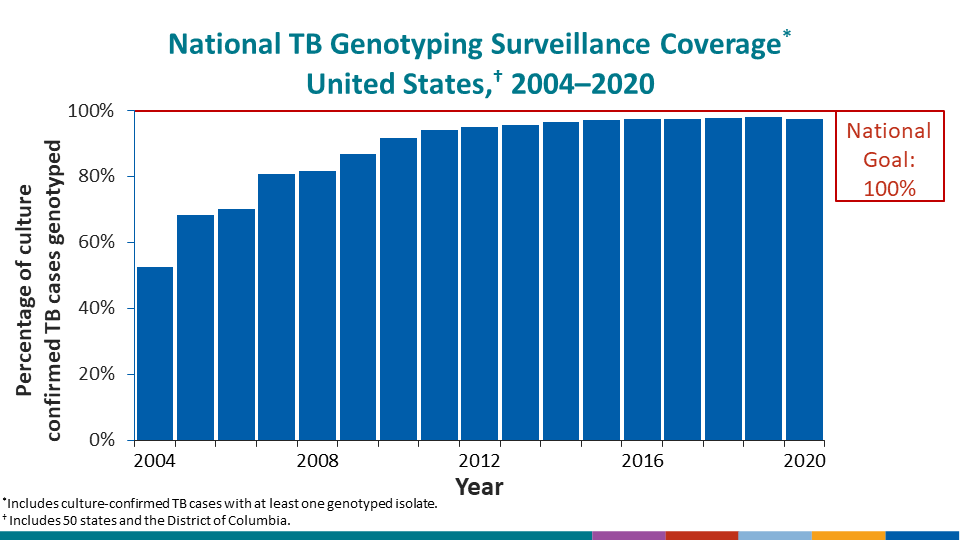
Table 16. National Tuberculosis Genotyping Surveillance Coverage:1 United States, 2004–2020
See Surveillance Slide #66.
| Year | Reported TB Cases | Reported Culture-Positive Cases | Cases with Genotype Results | Genotype Surveillance Coverage |
|---|---|---|---|---|
| No. | No. | No. | (%) | |
| 2004 | 14,502 | 11,330 | 5,954 | (52.6) |
| 2005 | 14,063 | 10,955 | 7,497 | (68.4) |
| 2006 | 13,730 | 10,747 | 7,528 | (70.0) |
| 2007 | 13,288 | 10,434 | 8,425 | (80.7) |
| 2008 | 12,893 | 10,024 | 8,176 | (81.6) |
| 2009 | 11,499 | 8,866 | 7,701 | (86.9) |
| 2010 | 11,076 | 8,391 | 7,684 | (91.6) |
| 2011 | 10,480 | 8,063 | 7,597 | (94.2) |
| 2012 | 9,925 | 7,616 | 7,224 | (94.9) |
| 2013 | 9,545 | 7,355 | 7,048 | (95.8) |
| 2014 | 9,383 | 7,217 | 6,973 | (96.6) |
| 2015 | 9,536 | 7,409 | 7,199 | (97.2) |
| 2016 | 9,242 | 7,171 | 6,985 | (97.4) |
| 2017 | 9,071 | 7,130 | 6,945 | (97.4) |
| 2018 | 9,006 | 7,102 | 6,954 | (97.9) |
| 2019 | 8,904 | 7,100 | 6,966 | (98.1) |
| 2020 | 7,174 | 5,691 | 5,551 | (97.5) |
1Genotype surveillance coverage is defined as the percentage of all culture positive tuberculosis (TB) cases for which there was a genotyped isolate.
Note: This table reflects genotyping surveillance coverage for the 50 states and the District of Columbia; for genotyping surveillance coverage of the U.S.-affiliated areas, please see Table 17.