Reported Tuberculosis in the United States, 2020
Table 15. Extrapulmonary Tuberculosis Cases and Percentages by Site of Disease: United States, 2010–2020
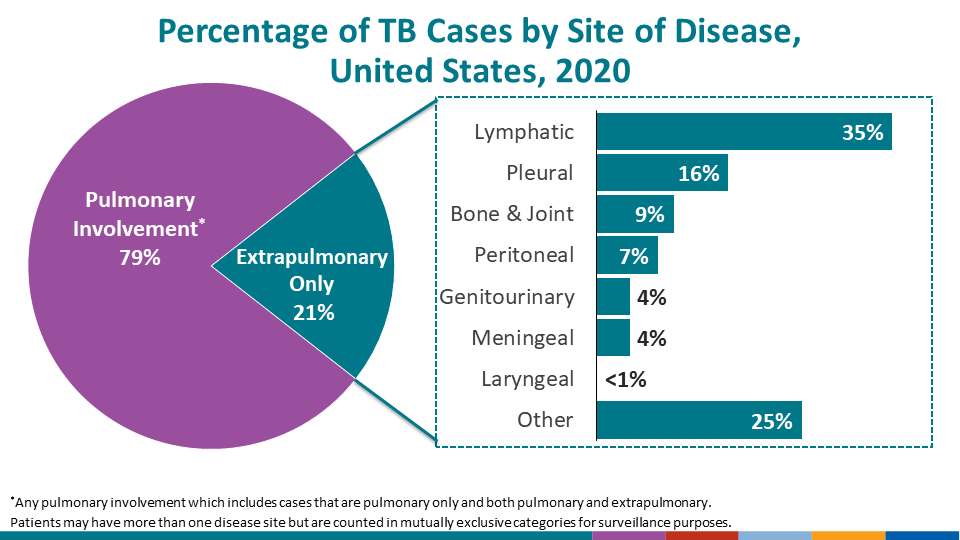
See Surveillance Slide #48.
| Year | Total Extrapulmonary Cases1 | Total Extrapulmonary Sites2 | Site of Disease | |||||||||||||||
|---|---|---|---|---|---|---|---|---|---|---|---|---|---|---|---|---|---|---|
| Pleural | Lymphatic | Bone or Joint | Genitourinary | Meningeal | Peritoneal | Laryngeal | Other | |||||||||||
| No. | (%) | No. | (%) | No. | (%) | No. | (%) | No. | (%) | No. | (%) | No. | (%) | No. | (%) | |||
| 2010 | 2,411 | 2,515 | 393 | (15.6) | 1,011 | (40.2) | 270 | (10.7) | 115 | (4.6) | 138 | (5.5) | 140 | (5.6) | 2 | (0.1) | 446 | (17.7) |
| 2011 | 2,163 | 2,284 | 391 | (17.1) | 863 | (37.8) | 249 | (10.9) | 115 | (5.0) | 132 | (5.8) | 122 | (5.3) | 3 | (0.1) | 409 | (17.9) |
| 2012 | 2,078 | 2,190 | 365 | (16.7) | 844 | (38.5) | 226 | (10.3) | 109 | (5.0) | 103 | (4.7) | 126 | (5.8) | 4 | (0.2) | 413 | (18.9) |
| 2013 | 1,969 | 2,079 | 355 | (17.1) | 748 | (36.0) | 221 | (10.6) | 103 | (5.0) | 109 | (5.2) | 121 | (5.8) | 4 | (0.2) | 418 | (20.1) |
| 2014 | 1,923 | 2,032 | 333 | (16.4) | 778 | (38.3) | 208 | (10.2) | 98 | (4.8) | 98 | (4.8) | 116 | (5.7) | 4 | (0.2) | 397 | (19.5) |
| 2015 | 1,905 | 2,009 | 343 | (17.1) | 720 | (35.8) | 194 | (9.7) | 90 | (4.5) | 92 | (4.6) | 126 | (6.3) | 3 | (0.1) | 441 | (22.0) |
| 2016 | 1,869 | 1,974 | 323 | (16.4) | 704 | (35.7) | 192 | (9.7) | 92 | (4.7) | 85 | (4.3) | 121 | (6.1) | 2 | (0.1) | 455 | (23.0) |
| 2017 | 1,874 | 2,003 | 318 | (15.9) | 752 | (37.5) | 181 | (9.0) | 85 | (4.2) | 88 | (4.4) | 119 | (5.9) | 0 | (0.0) | 460 | (23.0) |
| 2018 | 1,800 | 1,909 | 319 | (16.7) | 706 | (37.0) | 182 | (9.5) | 91 | (4.8) | 70 | (3.7) | 112 | (5.9) | 3 | (0.2) | 426 | (22.3) |
| 2019 | 1,818 | 1,937 | 355 | (18.3) | 675 | (34.8) | 167 | (8.6) | 76 | (3.9) | 85 | (4.4) | 116 | (6.0) | 2 | (0.1) | 461 | (23.8) |
| 2020 | 1,513 | 1,612 | 253 | (15.7) | 569 | (35.3) | 148 | (9.2) | 64 | (4.0) | 64 | (4.0) | 118 | (7.3) | 1 | (0.1) | 395 | (24.5) |
1Excludes cases with pulmonary site of disease and cases with site not stated.
2Patient might have more than one extrapulmonary site of disease.
See Technical Notes.