Reported Tuberculosis in the United States, 2020
Table 1. Tuberculosis Cases, Incidence Rates per 100,000 Population, Deaths, and Death Rates per 100,000 Population, and Percentage Change: United States, 1953–2020
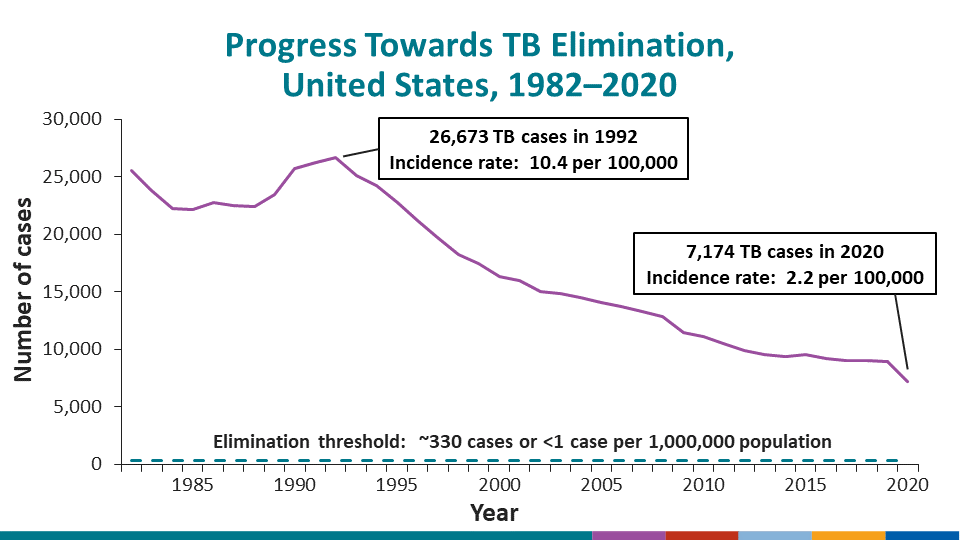
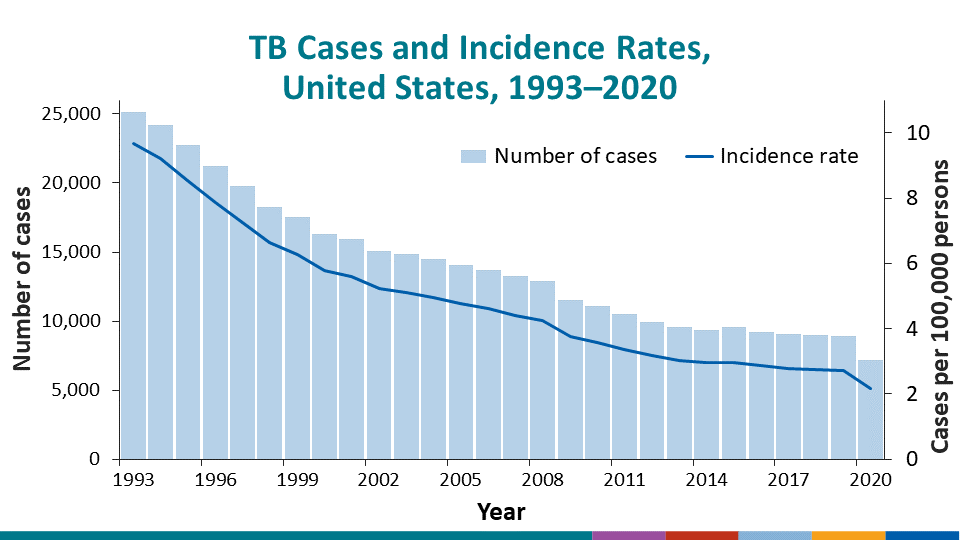
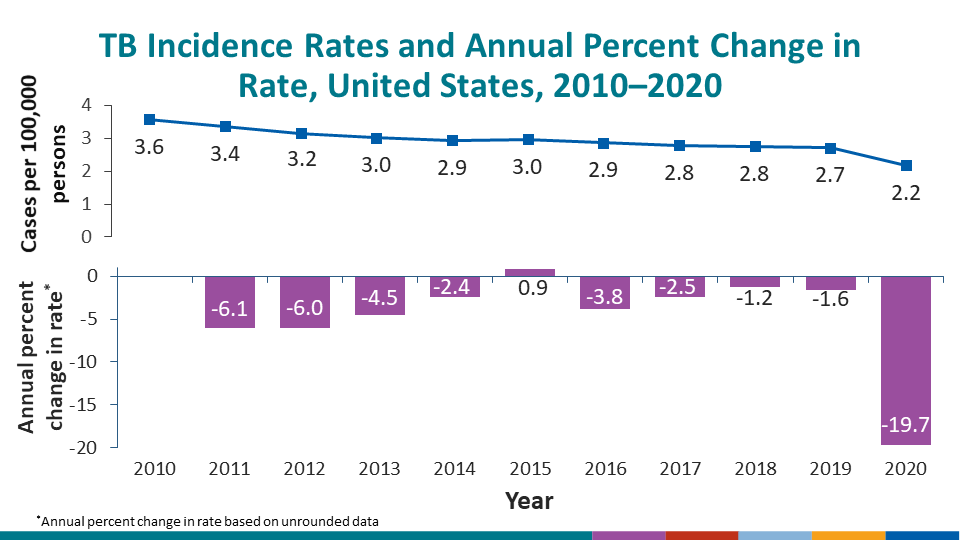
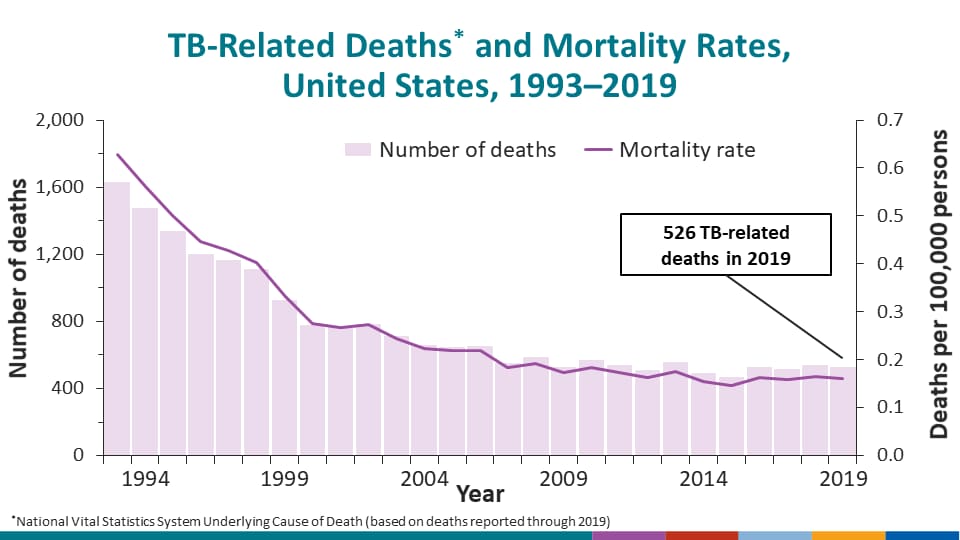
See Surveillance Slides #2, #3, #4, and #5.
| Tuberculosis Cases | Tuberculosis Deaths | ||||||||
|---|---|---|---|---|---|---|---|---|---|
| Percentage Change | Percentage Change | ||||||||
| Year | Number | Rate | Number | Rate | Number1 | Rate1 | Number | Rate | |
| 1953 | 84,304 | 52.6 | –– | –– | 19,707 | 12.4 | — | — | |
| 1954 | 79,775 | 48.9 | -5.4 | -7.0 | 16,527 | 10.2 | -16.1 | -17.7 | |
| 1955 | 77,368 | 46.6 | -3.0 | -4.7 | 15,016 | 9.1 | -9.1 | -10.8 | |
| 1956 | 69,895 | 41.4 | -9.7 | -11.1 | 14,137 | 8.4 | -5.9 | -7.7 | |
| 1957 | 67,149 | 39.0 | -3.9 | -5.8 | 13,390 | 7.8 | -5.3 | -7.1 | |
| 1958 | 63,534 | 36.3 | -5.4 | -6.9 | 12,417 | 7.1 | -7.3 | -9.0 | |
| 1959 | 57,535 | 32.4 | -9.4 | -10.7 | 11,474 | 6.5 | -7.6 | -8.5 | |
| 1960 | 55,494 | 30.7 | -3.5 | -5.2 | 10,866 | 6.0 | -5.3 | -7.7 | |
| 1961 | 53,726 | 29.2 | -3.2 | -4.9 | 9,938 | 5.4 | -8.5 | -10.0 | |
| 1962 | 53,315 | 28.6 | -0.8 | -2.1 | 9,506 | 5.1 | -4.3 | -5.6 | |
| 1963 | 54,042 | 28.6 | 1.4 | 0.0 | 9,311 | 4.9 | -2.1 | -3.9 | |
| 1964 | 50,874 | 26.5 | -5.9 | -7.3 | 8,303 | 4.3 | -10.8 | -12.2 | |
| 1965 | 49,016 | 25.2 | -3.7 | -4.9 | 7,934 | 4.1 | -4.4 | -4.7 | |
| 1966 | 47,767 | 24.3 | -2.5 | -3.6 | 7,625 | 3.9 | -3.9 | -4.9 | |
| 1967 | 45,647 | 23.0 | -4.4 | -5.3 | 6,901 | 3.5 | -9.5 | -10.3 | |
| 1968 | 42,623 | 21.2 | -6.6 | -7.8 | 6,292 | 3.1 | -8.8 | -11.4 | |
| 1969 | 39,120 | 19.3 | -8.2 | -9.0 | 5,567 | 2.8 | -11.5 | -9.7 | |
| 1970 | 37,137 | 18.1 | -5.1 | -6.2 | 5,217 | 2.6 | -6.3 | -7.1 | |
| 1971 | 35,217 | 17.0 | -5.2 | -6.1 | 4,501 | 2.2 | -13.7 | -15.4 | |
| 1972 | 32,882 | 15.7 | -6.6 | -7.6 | 4,376 | 2.1 | -2.8 | -4.5 | |
| 1973 | 30,998 | 14.6 | -5.7 | -7.0 | 3,875 | 1.8 | -11.4 | -14.5 | |
| 1974 2 | 30,122 | 14.1 | -2.8 | -3.4 | 3,513 | 1.7 | -9.3 | -5.6 | |
| 1975 | 33,989 | 15.7 | –– | –– | 3,333 | 1.6 | -5.1 | -5.9 | |
| 1976 | 32,105 | 14.7 | -5.5 | -6.4 | 3,130 | 1.5 | -6.1 | -6.3 | |
| 1977 | 30,145 | 13.7 | -6.1 | -6.8 | 2,968 | 1.4 | -5.2 | -6.7 | |
| 1978 | 28,521 | 12.8 | -5.4 | -6.6 | 2,914 | 1.3 | -1.8 | -7.1 | |
| 1979 3 | 27,669 | 12.3 | -3.0 | -3.9 | 2,007 | 0.9 | -31.1 | -30.8 | |
| 1980 | 27,749 | 12.2 | 0.3 | -0.7 | 1,978 | 0.9 | -1.4 | -3.3 | |
| 1981 | 27,373 | 11.9 | -1.4 | -2.3 | 1,937 | 0.8 | -2.1 | -3.0 | |
| 1982 | 25,520 | 11.0 | -6.8 | -7.7 | 1,807 | 0.8 | -6.7 | -7.6 | |
| 1983 | 23,846 | 10.2 | -6.6 | -7.4 | 1,779 | 0.8 | -1.5 | -2.4 | |
| 1984 | 22,255 | 9.4 | -6.7 | -7.5 | 1,729 | 0.7 | -2.8 | -3.6 | |
| 1985 | 22,201 | 9.3 | -0.2 | -1.1 | 1,752 | 0.7 | 1.3 | 0.4 | |
| 1986 | 22,768 | 9.5 | 2.6 | 1.6 | 1,782 | 0.7 | 1.7 | 0.8 | |
| 1987 | 22,517 | 9.3 | -1.1 | -2.0 | 1,755 | 0.7 | -1.5 | -2.4 | |
| 1988 | 22,436 | 9.2 | -0.4 | -1.3 | 1,921 | 0.8 | 9.5 | 8.5 | |
| 1989 | 23,495 | 9.5 | 4.7 | 3.7 | 1,970 | 0.8 | 2.6 | 1.6 | |
| 1990 | 25,701 | 10.3 | 9.4 | 8.2 | 1,810 | 0.7 | -8.1 | -9.2 | |
| 1991 | 26,283 | 10.4 | 2.3 | 0.9 | 1,713 | 0.7 | -5.4 | -6.6 | |
| 1992 | 26,673 | 10.4 | 1.5 | 0.1 | 1,705 | 0.7 | -0.5 | -1.8 | |
| 1993 | 25,105 | 9.7 | -5.9 | -7.1 | 1,631 | 0.6 | -4.3 | -5.6 | |
| 1994 | 24,208 | 9.2 | -3.6 | -4.7 | 1,478 | 0.6 | -9.4 | -10.5 | |
| 1995 | 22,727 | 8.5 | -6.1 | -7.2 | 1,336 | 0.5 | -9.6 | -10.7 | |
| 1996 | 21,212 | 7.9 | -6.7 | -7.7 | 1,202 | 0.4 | -10.0 | -11.1 | |
| 1997 | 19,753 | 7.2 | -6.9 | -8.0 | 1,166 | 0.4 | -3.0 | -4.2 | |
| 1998 | 18,288 | 6.6 | -7.4 | -8.5 | 1,112 | 0.4 | -4.6 | -5.7 | |
| 1999 | 17,500 | 6.3 | -4.3 | -5.4 | 930 | 0.3 | -16.4 | -17.3 | |
| 2000 | 16,308 | 5.8 | -6.8 | -7.8 | 776 | 0.3 | -16.6 | -17.5 | |
| 2001 | 15,949 | 5.6 | -2.2 | -3.2 | 764 | 0.3 | -1.5 | -2.5 | |
| 2002 | 15,060 | 5.2 | -5.6 | -6.4 | 784 | 0.3 | 2.6 | 1.7 | |
| 2003 | 14,838 | 5.1 | -1.5 | -2.3 | 711 | 0.2 | -9.3 | -10.1 | |
| 2004 | 14,502 | 5.0 | -2.3 | -3.2 | 657 | 0.2 | -7.6 | -8.4 | |
| 2005 | 14,063 | 4.8 | -3.0 | -3.9 | 648 | 0.2 | -1.4 | -2.3 | |
| 2006 | 13,730 | 4.6 | -2.4 | -3.3 | 652 | 0.2 | 0.6 | -0.3 | |
| 2007 | 13,288 | 4.4 | -3.2 | -4.1 | 554 | 0.2 | -15.0 | -15.8 | |
| 2008 | 12,893 | 4.2 | -3.0 | -3.9 | 585 | 0.2 | 5.6 | 4.6 | |
| 2009 | 11,499 | 3.7 | -10.8 | -11.6 | 529 | 0.2 | -9.6 | -10.4 | |
| 2010 | 11,076 | 3.6 | -3.7 | -4.5 | 569 | 0.2 | 7.6 | 6.7 | |
| 2011 | 10,480 | 3.4 | -5.4 | -6.1 | 539 | 0.2 | -5.3 | -6.0 | |
| 2012 | 9,925 | 3.2 | -5.3 | -6.0 | 510 | 0.2 | -5.4 | -6.1 | |
| 2013 | 9,545 | 3.0 | -3.8 | -4.5 | 555 | 0.2 | 8.8 | 8.1 | |
| 2014 | 9,383 | 2.9 | -1.7 | -2.4 | 493 | 0.2 | -11.2 | -11.8 | |
| 2015 | 9,536 | 3.0 | 1.6 | 0.9 | 470 | 0.1 | -4.7 | -5.4 | |
| 2016 | 9,242 | 2.9 | -3.1 | -3.8 | 528 | 0.2 | 12.3 | 11.5 | |
| 2017 | 9,071 | 2.8 | -1.9 | -2.5 | 515 | 0.2 | -2.5 | -3.1 | |
| 2018 | 9,006 | 2.8 | -0.7 | -1.2 | 542 | 0.2 | 5.2 | 4.7 | |
| 2019 | 8,904 | 2.7 | -1.1 | -1.6 | 526 | 0.2 | -3.0 | -3.4 | |
| 2020 | 7,174 | 2.2 | -19.4 | -19.7 | –– | –– | –– | –– | |
1Official tuberculosis mortality statistics were compiled by the National Center for Health Statistics, CDC (*); accessed June 22, 2021.
2Case data after 1974 are not comparable to prior years due to changes in the surveillance case definition that became effective in 1975.
3The large decrease in death rate in 1979 occurred because late effects of tuberculosis (e.g., bronchiectasis or fibrosis) and pleurisy with effusion (without mention of cause) are no longer included in tuberculosis deaths.
Percent change in tuberculosis death rates is calculated with unrounded figures.
Note: The 1993 to 2020 tuberculosis case counts and incidence rates were updated using the following sources: Bridged-Race 1990–1999 Intercensal Population Estimates for July 1, 1990–July 1, 1999, Intercensal Estimates of the Resident Population for the United States, Regions, States, and Puerto Rico: April 1, 2000 to July 1, 2010 and Annual Estimates of the Resident Population for the United States, Regions, States, and Puerto Rico: April 1, 2010 to July 1, 2020; accessed June 22, 2021.
Percentage change results reported to one decimal.
Double dashes (––) indicate that data are not available.