Reported Tuberculosis in the United States, 2019
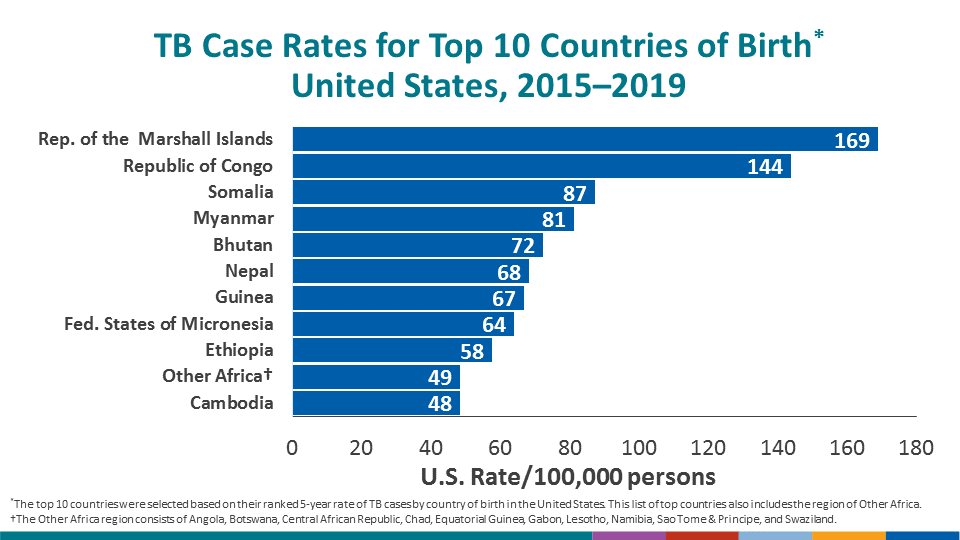
Table 6B. Tuberculosis Rates per 100,000 Population by Country of Birth in the United States by the Top 10 Countries of Birth1: United States, 2015–2019
See Surveillance Slides #13
| Country of Birth | Average Annual Number of Cases | Population Estimate2 | U.S. Rate by Country of Birth |
|---|---|---|---|
| Marshall Islands | 39.6 | 23,462 | 168.8 |
| Congo | 39.4 | 27,391 | 143.8 |
| Somalia | 84.2 | 96,463 | 87.3 |
| Myanmar | 117.2 | 144,354 | 81.2 |
| Bhutan | 40.8 | 56,457 | 72.3 |
| Nepal | 92.4 | 135,171 | 68.4 |
| Guinea | 11.4 | 17,034 | 66.9 |
| Fed. States of Micronesia | 19.8 | 30,988 | 63.9 |
| Ethiopia | 146.8 | 255,035 | 57.6 |
| Other Africa3 | 13.4 | 27,615 | 48.5 |
| Cambodia | 75.8 | 156,946 | 48.3 |
| Sierra Leone | 20.6 | 40,551 | 50.8 |
1The top 10 countries were selected based on their ranked 5-year rate of TB cases by country of birth in the United States.
2Population Estimates were obtained from the U.S. Census Bureau, American Community Survey (ACS) Public Use Microdata Sample (PUMS) data, 2014–2018 multiyear file. At the time of this report, the 2014–2018 had not been published yet. Population estimates of persons from countries with <10,000 persons living in the United States are grouped within Regions.
3The Other Africa region consists of Angola, Botswana, Central African Republic, Chad, Equatorial Guinea, Gabon, Lesotho, Namibia, Sao Tome & Principe, and Swaziland.
Note: Data for all years updated through June 10, 2020.